Optical Cable Corporation (OCC): Price and Financial Metrics
GET POWR RATINGS... FREE!
OCC Stock Summary
- OCC has a market capitalization of $34,853,991 -- more than approximately only 6.47% of US stocks.
- With a price/earnings ratio of 4.46, Optical Cable Corp P/E ratio is greater than that of about only 5.1% of stocks in our set with positive earnings.
- Over the past twelve months, OCC has reported earnings growth of -267.54%, putting it ahead of merely 7.28% of US stocks in our set.
- Stocks with similar financial metrics, market capitalization, and price volatility to Optical Cable Corp are VPG, STRT, UVE, WEYS, and ARC.
- Visit OCC's SEC page to see the company's official filings. To visit the company's web site, go to www.occfiber.com.
OCC Valuation Summary
- In comparison to the median Technology stock, OCC's price/sales ratio is 90.83% lower, now standing at 0.5.
- OCC's price/earnings ratio has moved up 1786 over the prior 243 months.
- Over the past 243 months, OCC's price/earnings ratio has gone up 1786.
Below are key valuation metrics over time for OCC.
Stock | Date | P/S | P/B | P/E | EV/EBIT |
---|---|---|---|---|---|
OCC | 2021-09-01 | 0.5 | 1.6 | -45.5 | 869.4 |
OCC | 2021-08-31 | 0.5 | 1.6 | -44.3 | 855.1 |
OCC | 2021-08-30 | 0.5 | 1.6 | -44.0 | 851.0 |
OCC | 2021-08-27 | 0.5 | 1.6 | -45.1 | 865.3 |
OCC | 2021-08-26 | 0.5 | 1.6 | -44.6 | 859.2 |
OCC | 2021-08-25 | 0.5 | 1.6 | -44.0 | 851.0 |
OCC Growth Metrics
- The 4 year revenue growth rate now stands at -6.71%.
- The 2 year net income to common stockholders growth rate now stands at -6321.54%.
- The year over year price growth rate now stands at 45.76%.

The table below shows OCC's growth in key financial areas (numbers in millions of US dollars).
Date | Revenue | Operating Cash Flow | Net Income to Common Stock |
---|---|---|---|
2021-12-31 | 61.70002 | -0.273345 | 7.816203 |
2021-09-30 | 59.13629 | 2.116588 | 6.610516 |
2021-06-30 | 57.13985 | -1.327382 | 6.210121 |
2021-03-31 | 55.14426 | -3.128836 | -0.596476 |
2020-12-31 | 54.26658 | -3.571322 | -5.670816 |
2020-09-30 | 55.2774 | -3.553137 | -6.121224 |
OCC Stock Price Chart Interactive Chart >
OCC Price/Volume Stats
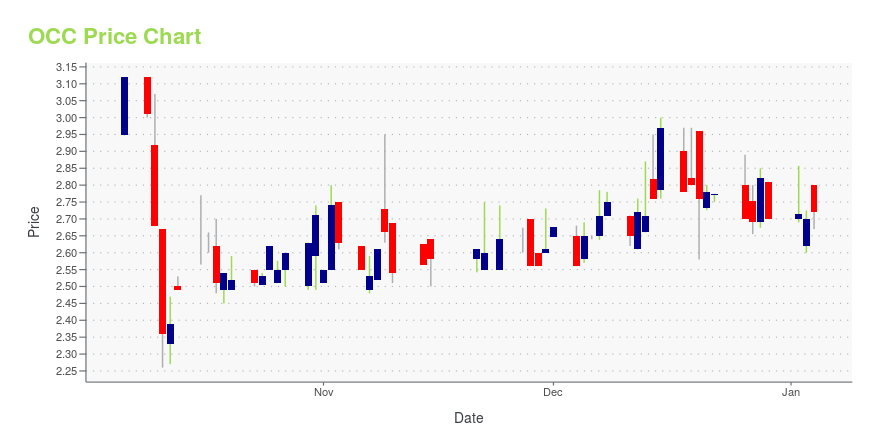
Current price | $3.67 | 52-week high | $6.84 |
Prev. close | $3.74 | 52-week low | $3.26 |
Day low | $3.67 | Volume | 1,051 |
Day high | $3.82 | Avg. volume | 14,000 |
50-day MA | $4.06 | Dividend yield | N/A |
200-day MA | $4.24 | Market Cap | 28.81M |
Latest OCC News From Around the Web
Below are the latest news stories about Optical Cable Corp that investors may wish to consider to help them evaluate OCC as an investment opportunity.
7 Telecom Stocks to Buy for MarchOne reason Telecom stocks like CFLD stock are attractive is because they are less susceptible to consumer spending trends than tech stocks. |
OPTICAL CABLE CORPORATION REPORTS FISCAL YEAR AND FOURTH QUARTER 2021 FINANCIAL RESULTSOptical Cable Corporation (Nasdaq GM: OCC) ("OCC®" or the "Company") today announced financial results for its fiscal year 2021 and its fourth quarter ended October 31, 2021. |
Optical Cable Co. (NASDAQ:OCC) Short Interest Up 37.2% in NovemberOptical Cable Co. (NASDAQ:OCC) saw a significant increase in short interest in the month of November. As of November 30th, there was short interest totalling 11,800 shares, an increase of 37.2% from the November 15th total of 8,600 shares. Based on an average daily volume of 21,700 shares, the short-interest ratio is currently 0.5 days. [] |
OPTICAL CABLE CORPORATION SCHEDULES CONFERENCE CALL TO DISCUSS FOURTH QUARTER AND FISCAL YEAR 2021 RESULTSOptical Cable Corporation (Nasdaq GM: OCC) ("OCC®") today announced that it will release its fourth quarter and fiscal year 2021 results on Monday, December 20, 2021. The fourth quarter and full year results are for the three-month and twelve-month periods ended October 31, 2021. The Company will also host a conference call on Monday, December 20, 2021 at 10:00 a.m. Eastern Time. |
Optical Cable (NASDAQ:OCC) Share Price Passes Above 200-Day Moving Average of $3.84Shares of Optical Cable Co. (NASDAQ:OCC) crossed above its 200-day moving average during trading on Friday . The stock has a 200-day moving average of $3.84 and traded as high as $5.70. Optical Cable shares last traded at $4.75, with a volume of 64,751 shares. The company has a current ratio of 5.28, a quick [] |
OCC Price Returns
1-mo | -5.90% |
3-mo | -21.75% |
6-mo | -14.31% |
1-year | 7.60% |
3-year | -21.08% |
5-year | 28.77% |
YTD | -31.66% |
2021 | 100.30% |
2020 | -17.51% |
2019 | -14.70% |
2018 | 58.09% |
2017 | -19.93% |
Continue Researching OCC
Here are a few links from around the web to help you further your research on Optical Cable Corp's stock as an investment opportunity:Optical Cable Corp (OCC) Stock Price | Nasdaq
Optical Cable Corp (OCC) Stock Quote, History and News - Yahoo Finance
Optical Cable Corp (OCC) Stock Price and Basic Information | MarketWatch
Loading social stream, please wait...