O-I Glass Inc. (OI): Price and Financial Metrics
OI Price/Volume Stats
Current price | $15.32 | 52-week high | $23.57 |
Prev. close | $15.35 | 52-week low | $13.56 |
Day low | $15.30 | Volume | 1,113,200 |
Day high | $15.66 | Avg. volume | 1,240,811 |
50-day MA | $15.28 | Dividend yield | N/A |
200-day MA | $19.67 | Market Cap | 2.37B |
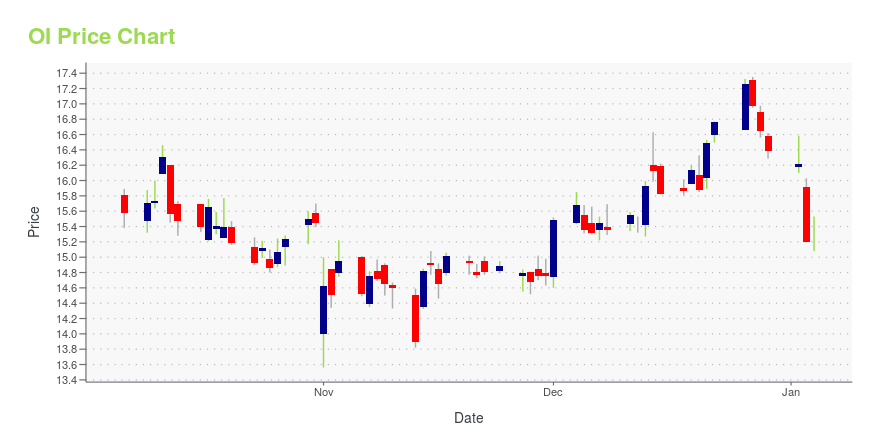
OI Stock Price Chart Interactive Chart >
OI POWR Grades
- Value is the dimension where OI ranks best; there it ranks ahead of 98.13% of US stocks.
- OI's strongest trending metric is Sentiment; it's been moving down over the last 177 days.
- OI's current lowest rank is in the Sentiment metric (where it is better than 22.53% of US stocks).
OI Stock Summary
- OI's current price/earnings ratio is 6.31, which is higher than only 9.05% of US stocks with positive earnings.
- Price to trailing twelve month operating cash flow for OI is currently 2.94, higher than merely 10.23% of US stocks with positive operating cash flow.
- For OI, its debt to operating expenses ratio is greater than that reported by 88.82% of US equities we're observing.
- If you're looking for stocks that are quantitatively similar to O-I GLASS INC, a group of peers worth examining would be CBT, OEC, SKYT, PNR, and VTRS.
- OI's SEC filings can be seen here. And to visit O-I GLASS INC's official web site, go to www.o-i.com.
OI Valuation Summary
- In comparison to the median Consumer Cyclical stock, OI's price/earnings ratio is 60.87% lower, now standing at 6.3.
- Over the past 243 months, OI's price/sales ratio has gone down 0.
Below are key valuation metrics over time for OI.
Stock | Date | P/S | P/B | P/E | EV/EBIT |
---|---|---|---|---|---|
OI | 2023-12-01 | 0.3 | 1.1 | 6.3 | 7.7 |
OI | 2023-11-30 | 0.3 | 1.1 | 6.0 | 7.5 |
OI | 2023-11-29 | 0.3 | 1.1 | 6.0 | 7.5 |
OI | 2023-11-28 | 0.3 | 1.1 | 6.0 | 7.5 |
OI | 2023-11-27 | 0.3 | 1.1 | 6.0 | 7.5 |
OI | 2023-11-24 | 0.3 | 1.1 | 6.1 | 7.6 |
OI Growth Metrics
- Its year over year net income to common stockholders growth rate is now at 230.69%.
- Its 3 year net cashflow from operations growth rate is now at 18.37%.
- The year over year price growth rate now stands at -23.29%.

The table below shows OI's growth in key financial areas (numbers in millions of US dollars).
Date | Revenue | Operating Cash Flow | Net Income to Common Stock |
---|---|---|---|
2022-12-31 | 6,856 | 154 | 584 |
2022-09-30 | 6,750 | 7 | 614 |
2022-06-30 | 6,666 | 664 | 468 |
2022-03-31 | 6,548 | 670 | 334 |
2021-12-31 | 6,357 | 687 | 149 |
2021-09-30 | 6,265 | 785 | 77 |
OI's Quality Factors
The “Quality” component of the POWR Ratings focuses on 31 different factors of a companies fundamentals and operational strength. Here are some key insights as we drill into the specifics of these quality attributes.- OI has a Quality Grade of C, ranking ahead of 69.2% of graded US stocks.
- OI's asset turnover comes in at 0.709 -- ranking 8th of 11 Shipping Containers stocks.
- DYSL, WRK, and GPK are the stocks whose asset turnover ratios are most correlated with OI.
The table below shows OI's key quality metrics over time.
Period | Asset Turnover | Gross Margin | ROIC |
---|---|---|---|
2021-09-30 | 0.709 | 0.178 | 0.050 |
2021-06-30 | 0.713 | 0.174 | 0.076 |
2021-03-31 | 0.672 | 0.157 | 0.046 |
2020-12-31 | 0.666 | 0.160 | 0.059 |
2020-09-30 | 0.667 | 0.158 | 0.066 |
2020-06-30 | 0.657 | 0.160 | -0.018 |
OI Price Target
For more insight on analysts targets of OI, see our OI price target page. And for a list of of all stocks sorted by upside potential based on analyst target price, see our Top Price Target page.
Average Price Target | $17.67 | Average Broker Recommendation | 1.81 (Hold) |
O-I Glass Inc. (OI) Company Bio
Owens-Illinois manufactures and sells glass container products to food and beverage manufacturers primarily in Europe, North America, South America, and the Asia Pacific. The company was founded in 1903 and is based in Perrysburg, Ohio.
Latest OI News From Around the Web
Below are the latest news stories about O-I GLASS INC that investors may wish to consider to help them evaluate OI as an investment opportunity.
O-I Announces New Partnerships To Increase Post Consumer Glass Recycling in BrazilBy Allen MirelesNORTHAMPTON, MA / ACCESSWIRE / November 30, 2023 / O-I's team in Brazil recently announced two exciting new partnerships that increase post-consumer glass recycling, reduce consumer waste, and conserve resources in Brazil.The partnerships ... |
O-I Glass to Present at Citi’s 2023 Basic Materials ConferencePERRYSBURG, Ohio, Nov. 15, 2023 (GLOBE NEWSWIRE) -- O-I Glass, Inc. (NYSE: OI) today announced the Company will participate in Citi’s 2023 Basic Materials Conference on Wednesday, November 29, 2023. O-I Glass Chief Executive Officer Andres Lopez and Chief Financial Officer John Haudrich will present at 10:15 a.m. ET. A live webcast of the presentation will be available at: https://kvgo.com/citi/o-i-glass-inc-november-2023 The replay will be available through the above link within 24 hours of the |
O-I Glass Presents Its 'Cento per Cento Sicilia' Bottles: Circular Economy Applied to Glass Production in SicilyThe project provides a sustainable solution to enhance the value of glass, the perfect material to support a low-waste circular economy in an area with a historic wine production that is profitable for the region's GDP itself - as one billion of Sicily's ... |
O-I Glass, Inc. (NYSE:OI) Q3 2023 Earnings Call TranscriptO-I Glass, Inc. (NYSE:OI) Q3 2023 Earnings Call Transcript November 1, 2023 Operator: Hello everyone, and welcome to the O-I Glass Third Quarter 2023 Earnings Conference Call. My name is Nadia and I will be called late in the call today. [Operator Instructions] I will now hand over to your host Chris Manuel, Vice President […] |
O-I GLASS REPORTS THIRD QUARTER 2023 RESULTSStrong Execution and Operational PerformancePERRYSBURG, Ohio, Oct. 31, 2023 (GLOBE NEWSWIRE) -- FOR IMMEDIATE RELEASE O-I Glass, Inc. (“O-I”) (NYSE: OI) today reported financial results for the third quarter ended September 30, 2023. Net Earnings Attributable to the Company Per Share (Diluted)Earnings Before Income Taxes$M3Q233Q223Q233Q22Reported$0.32$1.45$82$278 Adjusted EarningsPer Share (Diluted)Segment Operating Profit$M3Q233Q223Q233Q22Non – GAAP$0.80(Guidance: $0.68 -$0.73)$0.63$301$266 “O- |
OI Price Returns
1-mo | 3.86% |
3-mo | -17.77% |
6-mo | -26.63% |
1-year | -5.43% |
3-year | 20.82% |
5-year | -11.34% |
YTD | -7.54% |
2022 | 37.74% |
2021 | 1.09% |
2020 | 0.16% |
2019 | -29.69% |
2018 | -22.24% |
Continue Researching OI
Here are a few links from around the web to help you further your research on O-I Glass Inc's stock as an investment opportunity:O-I Glass Inc (OI) Stock Price | Nasdaq
O-I Glass Inc (OI) Stock Quote, History and News - Yahoo Finance
O-I Glass Inc (OI) Stock Price and Basic Information | MarketWatch
Loading social stream, please wait...