
Ollie's Bargain Outlet Holdings, Inc. (OLLI): Price and Financial Metrics
OLLI Price/Volume Stats
| Current price | $96.00 | 52-week high | $104.98 |
| Prev. close | $96.39 | 52-week low | $68.05 |
| Day low | $95.66 | Volume | 568,400 |
| Day high | $98.01 | Avg. volume | 1,006,041 |
| 50-day MA | $90.74 | Dividend yield | N/A |
| 200-day MA | $79.03 | Market Cap | 5.88B |
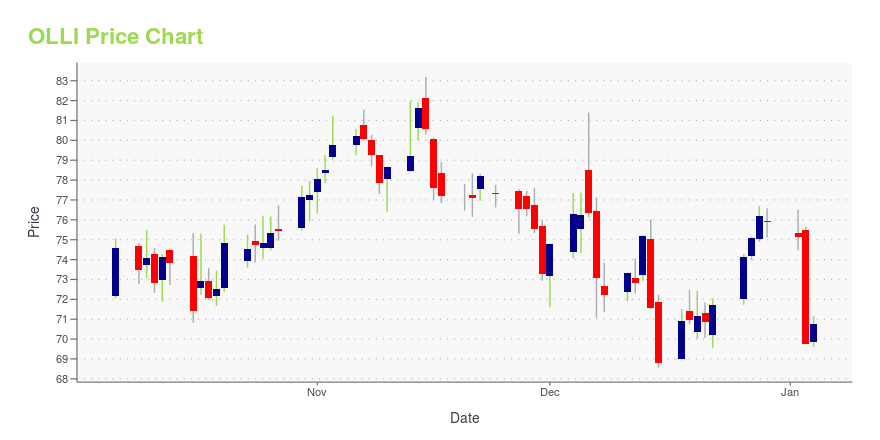
OLLI Stock Price Chart Interactive Chart >
Ollie's Bargain Outlet Holdings, Inc. (OLLI) Company Bio
Ollie's Bargain Outlet Holdings is a retailer of closeouts and excess inventory of various categories, including housewares, food, books and stationery, bed and bath, floor coverings, toys and hardware. The company was founded in 1982 and is based in Harrisburg, Pennsylvania.
Latest OLLI News From Around the Web
Below are the latest news stories about OLLIE'S BARGAIN OUTLET HOLDINGS INC that investors may wish to consider to help them evaluate OLLI as an investment opportunity.
Bearish Bets: 3 Stocks You Absolutely Should Think About Shorting This WeekUsing technical analysis of the charts of those stocks, and, when appropriate, recent actions and grades from TheStreet's Quant Ratings, we zero in on three names. Ollie's Bargain Outlet Holdings Inc. recently was downgraded to Hold with a C+ rating by TheStreet's Quant Ratings. The discount retailer was looking quite good until the stock took a big tumble in November. |
Is Ollie’s Bargain Outlet Holdings (OLLI) Well Positioned in the Competitive Market?Wasatch Global Investors, an investment management firm, released its “Wasatch Small Cap Growth Strategy” third quarter 2023 investor letter. A copy of the same can be downloaded here. Stocks fell broadly in the quarter as investors worried about the consequences of rising interest rates and a possible recession. During the quarter, the strategy declined but […] |
7 New Year’s Stocks to Buy to Get 2024 Off to a Bright StartWith another year in the global markets coming to a close, now is a great time to consider stocks to buy for 2024. |
Here's Why Sprouts Farmers (SFM) is Staying Ahead of IndustrySprouts Farmers (SFM) is benefiting from strategic initiatives, including omni-channel solutions, expanding customer base and focus on private-label products. |
Ollie’s Bargain Outlet Holdings (OLLI) Gained on Same Store Sales GrowthHarding Loevner, an asset management company, released its “Global Small Companies Equity Strategy” third-quarter 2023 investor letter. A copy of the same can be downloaded here. Global small caps fell sharply in the third quarter. Japan was the weakest region, although returns in healthcare were good and industrials detracted. The strategy returned -5.36% (net) compared to […] |
OLLI Price Returns
| 1-mo | -2.35% |
| 3-mo | 28.93% |
| 6-mo | 32.27% |
| 1-year | 32.21% |
| 3-year | 6.07% |
| 5-year | 7.97% |
| YTD | 26.50% |
| 2023 | 62.02% |
| 2022 | -8.50% |
| 2021 | -37.40% |
| 2020 | 25.20% |
| 2019 | -1.80% |
Continue Researching OLLI
Want to do more research on Ollie's Bargain Outlet Holdings Inc's stock and its price? Try the links below:Ollie's Bargain Outlet Holdings Inc (OLLI) Stock Price | Nasdaq
Ollie's Bargain Outlet Holdings Inc (OLLI) Stock Quote, History and News - Yahoo Finance
Ollie's Bargain Outlet Holdings Inc (OLLI) Stock Price and Basic Information | MarketWatch
Loading social stream, please wait...