
One Liberty Properties, Inc. (OLP): Price and Financial Metrics
OLP Price/Volume Stats
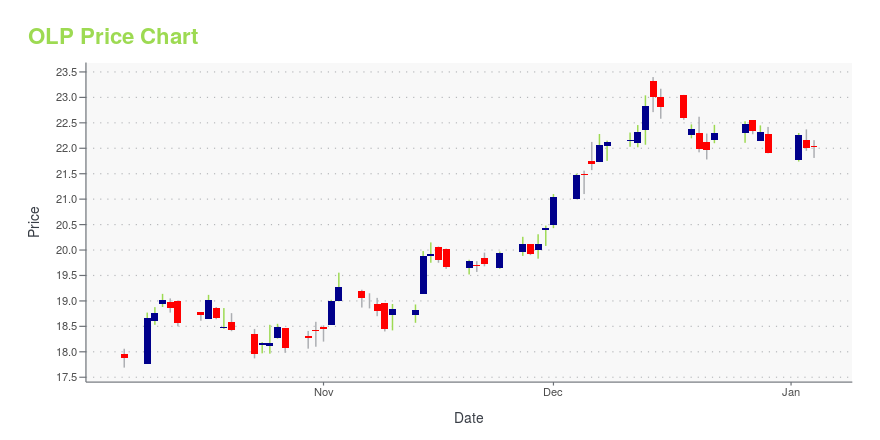
| Current price | $26.80 | 52-week high | $26.89 |
| Prev. close | $26.32 | 52-week low | $17.55 |
| Day low | $26.50 | Volume | 53,617 |
| Day high | $26.89 | Avg. volume | 53,878 |
| 50-day MA | $24.02 | Dividend yield | 6.84% |
| 200-day MA | $21.87 | Market Cap | 564.57M |
OLP Stock Price Chart Interactive Chart >
One Liberty Properties, Inc. (OLP) Company Bio
One Liberty Properties, Inc. engages in the acquisition, ownership, and management of commercial real estate properties in the United States. The company's property portfolio includes retail furniture stores, as well as industrial, office, flex, health and fitness, and other properties. The company was founded in 1982 and is based in Great Neck, New York.
Latest OLP News From Around the Web
Below are the latest news stories about ONE LIBERTY PROPERTIES INC that investors may wish to consider to help them evaluate OLP as an investment opportunity.
One Liberty (OLP) Completes Asset Sale Worth $63M in 2023One Liberty (OLP) carries out dispositions worth $63 million in 2023. Part of the proceeds was used to repay the outstanding balance on its credit facility. |
One Liberty Properties Raises $63 Million From Sale of 12 Assets in 2023– Closes On Six Previously Announced Asset Sales in Fourth Quarter –– Industrial Portfolio Expected to Represent 66% of 2024 Base Rent – GREAT NECK, N.Y., Dec. 21, 2023 (GLOBE NEWSWIRE) -- One Liberty Properties, Inc. (NYSE: OLP), an owner and manager of a geographically diversified portfolio consisting primarily of net-leased industrial properties, announced that it completed the sale of 12 assets for $63 million in 2023. During the fourth quarter, the Company closed on previously announced sal |
Should You Be Impressed By One Liberty Properties, Inc.'s (NYSE:OLP) ROE?While some investors are already well versed in financial metrics (hat tip), this article is for those who would like... |
One Liberty Properties Announces 124th Consecutive Quarterly Dividend– Increased or Maintained Dividend for Over 30 Consecutive Years – – Increases Current Share Repurchase Authorization – GREAT NECK, N.Y., Dec. 05, 2023 (GLOBE NEWSWIRE) -- One Liberty Properties, Inc. (NYSE: OLP) today announced that its Board of Directors declared a quarterly dividend on the Company’s common stock of $0.45 per share. The dividend is payable on January 5, 2024 to stockholders of record at the close of business on December 20, 2023, and represents One Liberty’s 124th consecutive |
One Liberty Properties Announces Asset Sales for $32 Million– Closes Sales of Three Properties –– Agrees to Sell Five Additional Assets –– Refinances Two Industrial Properties – GREAT NECK, N.Y., Nov. 30, 2023 (GLOBE NEWSWIRE) -- One Liberty Properties, Inc. (NYSE: OLP), an owner and manager of a geographically diversified portfolio consisting primarily of industrial properties, announced that it completed the sale of two restaurant properties and a portion of a retail property for a an aggregate sales price of approximately $8.7 million. The Company ant |
OLP Price Returns
| 1-mo | 17.49% |
| 3-mo | 20.15% |
| 6-mo | 31.79% |
| 1-year | 42.40% |
| 3-year | 9.80% |
| 5-year | 39.16% |
| YTD | 27.16% |
| 2023 | 7.57% |
| 2022 | -32.34% |
| 2021 | 87.10% |
| 2020 | -18.50% |
| 2019 | 19.44% |
OLP Dividends
| Ex-Dividend Date | Type | Payout Amount | Change | ||||||
|---|---|---|---|---|---|---|---|---|---|
| Loading, please wait... | |||||||||
Continue Researching OLP
Want to see what other sources are saying about One Liberty Properties Inc's financials and stock price? Try the links below:One Liberty Properties Inc (OLP) Stock Price | Nasdaq
One Liberty Properties Inc (OLP) Stock Quote, History and News - Yahoo Finance
One Liberty Properties Inc (OLP) Stock Price and Basic Information | MarketWatch
Loading social stream, please wait...