Odyssey Marine Exploration, Inc. (OMEX): Price and Financial Metrics
OMEX Price/Volume Stats
Current price | $3.81 | 52-week high | $5.07 |
Prev. close | $4.01 | 52-week low | $2.84 |
Day low | $3.76 | Volume | 254,000 |
Day high | $4.07 | Avg. volume | 83,610 |
50-day MA | $4.41 | Dividend yield | N/A |
200-day MA | $3.93 | Market Cap | 76.13M |
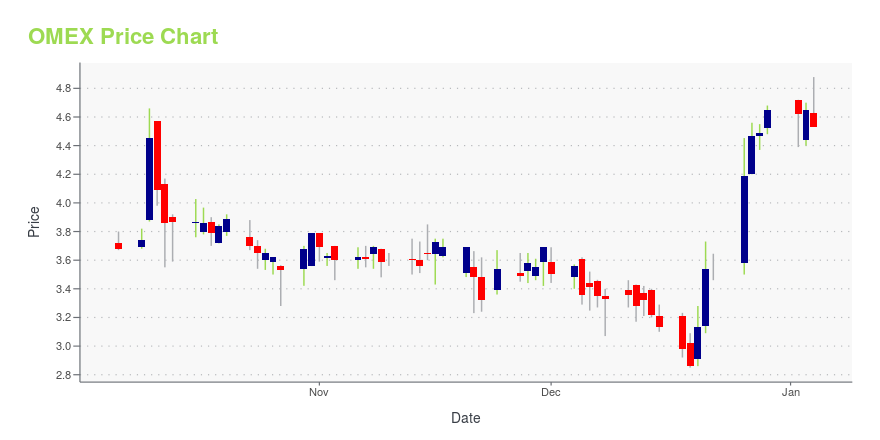
OMEX Stock Price Chart Interactive Chart >
OMEX POWR Grades
- Momentum is the dimension where OMEX ranks best; there it ranks ahead of 85.78% of US stocks.
- OMEX's strongest trending metric is Quality; it's been moving down over the last 26 weeks.
- OMEX ranks lowest in Quality; there it ranks in the 1st percentile.
OMEX Stock Summary
- OMEX's current price/earnings ratio is 142.99, which is higher than 95.7% of US stocks with positive earnings.
- OMEX's price/sales ratio is 84; that's higher than the P/S ratio of 97.48% of US stocks.
- In terms of twelve month growth in earnings before interest and taxes, ODYSSEY MARINE EXPLORATION INC is reporting a growth rate of -471.95%; that's higher than merely 2.78% of US stocks.
- Stocks that are quantitatively similar to OMEX, based on their financial statements, market capitalization, and price volatility, are BMRN, AGYS, HQY, HLIT, and POWI.
- Visit OMEX's SEC page to see the company's official filings. To visit the company's web site, go to www.odysseymarine.com.
OMEX Valuation Summary
- In comparison to the median Industrials stock, OMEX's price/earnings ratio is 532.3% higher, now standing at 142.9.
- OMEX's price/earnings ratio has moved up 194.8 over the prior 243 months.
Below are key valuation metrics over time for OMEX.
Stock | Date | P/S | P/B | P/E | EV/EBIT |
---|---|---|---|---|---|
OMEX | 2023-12-29 | 84.0 | -5.7 | 142.9 | 8.2 |
OMEX | 2023-12-28 | 81.1 | -5.5 | 138.0 | 8.0 |
OMEX | 2023-12-27 | 80.7 | -5.5 | 137.4 | 8.0 |
OMEX | 2023-12-26 | 75.7 | -5.1 | 128.8 | 7.6 |
OMEX | 2023-12-22 | 64.6 | -4.4 | 110.0 | 6.9 |
OMEX | 2023-12-21 | 63.9 | -4.3 | 108.8 | 6.8 |
OMEX Growth Metrics
- The 2 year net income to common stockholders growth rate now stands at -18.87%.
- Its year over year revenue growth rate is now at -29.85%.
- Its 3 year revenue growth rate is now at -73.89%.
The table below shows OMEX's growth in key financial areas (numbers in millions of US dollars).
Date | Revenue | Operating Cash Flow | Net Income to Common Stock |
---|---|---|---|
2022-09-30 | 1.29847 | -7.199102 | -18.29232 |
2022-06-30 | 1.137112 | -5.1377 | -16.92239 |
2022-03-31 | 0.929168 | -5.558017 | -14.46641 |
2021-12-31 | 0.921238 | -5.303479 | -9.956395 |
2021-09-30 | 0.972374 | -7.902988 | -12.40053 |
2021-06-30 | 0.986861 | -9.530157 | -13.76328 |
Odyssey Marine Exploration, Inc. (OMEX) Company Bio
Odyssey Marine Exploration, Inc. specializes in shipwreck search, recovery, and marketing. The Company focuses on deep ocean shipwrecks and conducts salvage operations, cargo recovery services, and archaeological artifact finds.
Latest OMEX News From Around the Web
Below are the latest news stories about ODYSSEY MARINE EXPLORATION INC that investors may wish to consider to help them evaluate OMEX as an investment opportunity.
Odyssey Marine Exploration Secures Strategic Debt Financing DealTAMPA, Fla., December 04, 2023--Odyssey Marine Exploration, Inc. (NASDAQ: OMEX), a global subsea mineral exploration, validation, and development company, reported today that it took a significant financial step by entering into a note and warrant purchase agreement with several of the company's largest institutional investors on December 1, 2024. |
Health Care Roundup: Market TalkFind insights on Family Dollar, Blau Farmacêutica, Fisher & Paykel, and more in the latest Market Talks covering the Health Care sector. |
Odyssey Marine Exploration Addresses NASDAQ Compliance MattersTAMPA, Fla., November 28, 2023--Odyssey Marine Exploration, Inc. (NASDAQ: OMEX), a global subsea mineral exploration and validation company, reported that on November 21, 2023, Odyssey received a notice from Nasdaq Regulation that Odyssey is not in compliance with Nasdaq Rule 5250(c)(1) because it had not yet filed its Form 10-Q for the period ended September 30, 2023 (the "Form 10-Q") with the Securities and Exchange Commission (SEC). Odyssey plans to regain compliance with Nasdaq Rule 5250(c)( |
The past five years for Odyssey Marine Exploration (NASDAQ:OMEX) investors has not been profitableWhile not a mind-blowing move, it is good to see that the Odyssey Marine Exploration, Inc. ( NASDAQ:OMEX ) share price... |
Odyssey Marine Exploration Announces the Departure of its Chief Financial OfficerTAMPA, Fla., June 13, 2023--Odyssey Marine Exploration, Inc. (NASDAQ: OMEX), a global subsea mineral exploration, validation, and development company, announced that Christopher E. Jones, Odyssey’s Chief Financial Officer (CFO), will leave the company on July 7, 2023, to pursue another opportunity. |
OMEX Price Returns
1-mo | -16.63% |
3-mo | -18.06% |
6-mo | 1.87% |
1-year | 20.57% |
3-year | -44.78% |
5-year | -46.79% |
YTD | -18.06% |
2023 | 19.85% |
2022 | -25.38% |
2021 | -26.76% |
2020 | 122.57% |
2019 | -4.20% |
Continue Researching OMEX
Here are a few links from around the web to help you further your research on Odyssey Marine Exploration Inc's stock as an investment opportunity:Odyssey Marine Exploration Inc (OMEX) Stock Price | Nasdaq
Odyssey Marine Exploration Inc (OMEX) Stock Quote, History and News - Yahoo Finance
Odyssey Marine Exploration Inc (OMEX) Stock Price and Basic Information | MarketWatch
Loading social stream, please wait...