
Offerpad Solutions Inc. Cl A (OPAD): Price and Financial Metrics
OPAD Price/Volume Stats
| Current price | $4.62 | 52-week high | $13.36 |
| Prev. close | $4.60 | 52-week low | $3.83 |
| Day low | $4.43 | Volume | 23,097 |
| Day high | $4.65 | Avg. volume | 49,813 |
| 50-day MA | $4.82 | Dividend yield | N/A |
| 200-day MA | $7.66 | Market Cap | 126.06M |
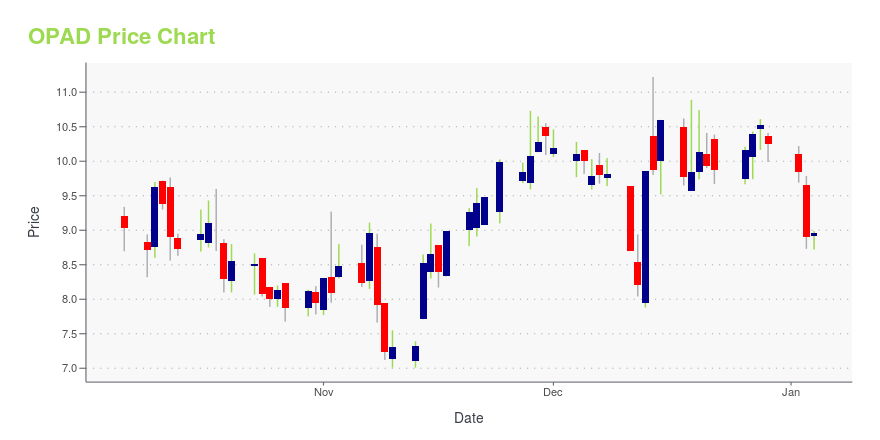
OPAD Stock Price Chart Interactive Chart >
Offerpad Solutions Inc. Cl A (OPAD) Company Bio
Offerpad Solutions, Inc. operates a real estate platform that enables consumers to seamlessly buy and sell their homes using a mobile device. The company was founded by Brian Bair in July 2015 and is headquartered in Chandler, AZ.
Latest OPAD News From Around the Web
Below are the latest news stories about OFFERPAD SOLUTIONS INC that investors may wish to consider to help them evaluate OPAD as an investment opportunity.
Offerpad Reports Third Quarter 2023 ResultsCHANDLER, Ariz., November 01, 2023--Offerpad Solutions Inc. ("Offerpad") (NYSE: OPAD), a leading tech-enabled platform for residential real estate, today released financial results for the three months ended September 30, 2023. |
Offerpad Selects Anywhere℠ to Serve Sellers Beyond Current Market ReachCHANDLER, Ariz., October 26, 2023--Offerpad Solutions Inc. ("Offerpad") (NYSE: OPAD), a leading tech-driven platform for residential real estate operating in 14 states and over 1,000 cities, has unveiled a nationwide collaboration with Anywhere Real Estate, Inc., a global leader in residential real estate services. This program extends Offerpad's reach, allowing seller requests from areas outside of Offerpad's coverage to be served by certified agents affiliated with the Anywhere Leads Network. |
Offerpad Teams with Clemson University as Official Partner of the Clemson TigersCHANDLER, Ariz., October 12, 2023--Offerpad has signed a multi-year agreement to appear as a sponsor at all Clemson Tigers home games over the next three seasons. |
Offerpad to Release Third-Quarter Results on November 1stCHANDLER, Ariz., October 11, 2023--Offerpad Solutions Inc. ("Offerpad") (NYSE: OPAD), a leading tech-enabled platform for residential real estate, announced today the company will release third-quarter financial results on Wednesday, November 1, 2023. The company also will host a conference call at 4:30 p.m. ET that same day to discuss financial results and recent developments. |
Offerpad Announces Participation in Goldman Sachs Communacopia + Technology ConferenceCHANDLER, Ariz., August 23, 2023--Offerpad Solutions Inc. (NYSE: OPAD), a leading tech-enabled platform for residential real estate, today announced that Brian Bair, Offerpad’s Chairman and CEO, will participate in a fireside chat at 8:50 am PT on Wednesday, September 6, 2023 at the Goldman Sachs Communacopia + Technology Conference. A live webcast can be accessed under the "Events & Presentations" section of Offerpad’s Investor Relations website at investor.offerpad.com. A webcast replay will b |
OPAD Price Returns
| 1-mo | 10.26% |
| 3-mo | -44.27% |
| 6-mo | -47.80% |
| 1-year | -53.29% |
| 3-year | -96.90% |
| 5-year | N/A |
| YTD | -54.93% |
| 2023 | 48.39% |
| 2022 | -92.80% |
| 2021 | -41.82% |
| 2020 | N/A |
| 2019 | N/A |
Loading social stream, please wait...