Opendoor Technologies Inc. (OPEN): Price and Financial Metrics
OPEN Price/Volume Stats
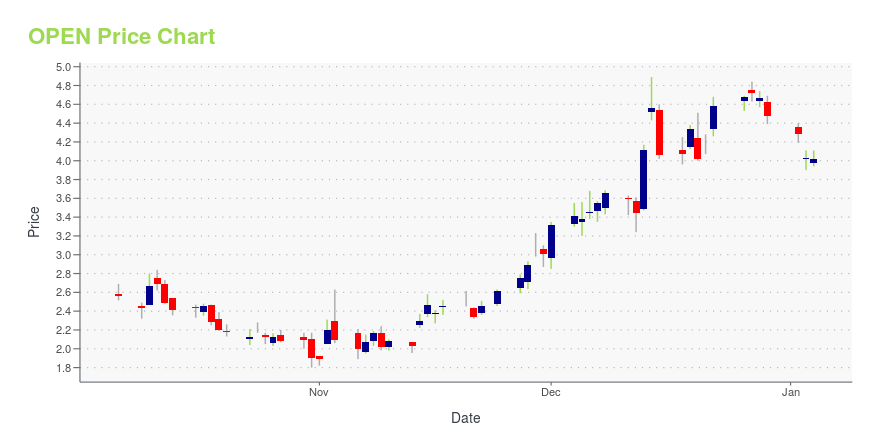
Current price | $2.46 | 52-week high | $8.08 |
Prev. close | $2.36 | 52-week low | $0.92 |
Day low | $2.29 | Volume | 29,623,795 |
Day high | $2.49 | Avg. volume | 23,696,482 |
50-day MA | $1.80 | Dividend yield | N/A |
200-day MA | $2.28 | Market Cap | 1.60B |
OPEN Stock Price Chart Interactive Chart >
OPEN POWR Grades
- OPEN scores best on the Value dimension, with a Value rank ahead of 86.52% of US stocks.
- The strongest trend for OPEN is in Value, which has been heading up over the past 179 days.
- OPEN ranks lowest in Growth; there it ranks in the 1st percentile.
OPEN Stock Summary
- OPENDOOR TECHNOLOGIES INC's capital turnover -- a measure of revenue relative to shareholder's equity -- is better than 97.25% of US listed stocks.
- Over the past twelve months, OPEN has reported earnings growth of 569.51%, putting it ahead of 97.16% of US stocks in our set.
- OPENDOOR TECHNOLOGIES INC's shareholder yield -- a measure of how much capital is returned to stockholders via dividends and buybacks -- is 106.55%, greater than the shareholder yield of 97.86% of stocks in our set.
- Stocks that are quantitatively similar to OPEN, based on their financial statements, market capitalization, and price volatility, are NGVT, TTMI, XERS, LPRO, and TCX.
- To check out OPENDOOR TECHNOLOGIES INC's SEC filings, go to the company's page on browse-edgar?action=getcompany&CIK=0001801169.
OPEN Valuation Summary
- In comparison to the median Real Estate stock, OPEN's price/sales ratio is 90.91% lower, now standing at 0.1.
- Over the past 37 months, OPEN's EV/EBIT ratio has gone down 0.9.
Below are key valuation metrics over time for OPEN.
Stock | Date | P/S | P/B | P/E | EV/EBIT |
---|---|---|---|---|---|
OPEN | 2023-05-11 | 0.1 | 1.3 | -0.9 | -2.5 |
OPEN | 2023-05-10 | 0.1 | 1.3 | -0.9 | -2.5 |
OPEN | 2023-05-09 | 0.1 | 1.3 | -0.9 | -2.5 |
OPEN | 2023-05-08 | 0.1 | 1.3 | -0.9 | -2.4 |
OPEN | 2023-05-05 | 0.1 | 1.1 | -0.8 | -2.3 |
OPEN | 2023-05-04 | 0.1 | 0.8 | -0.6 | -2.0 |
OPEN's Quality Factors
The “Quality” component of the POWR Ratings focuses on 31 different factors of a companies fundamentals and operational strength. Here are some key insights as we drill into the specifics of these quality attributes.- OPEN has a Quality Grade of F, ranking ahead of 4.42% of graded US stocks.
- OPEN's asset turnover comes in at 1.683 -- ranking 4th of 63 Real Estate stocks.
- 500 - Internal server error
The table below shows OPEN's key quality metrics over time.
Period | Asset Turnover | Gross Margin | ROIC |
---|---|---|---|
2021-06-30 | 1.683 | 0.105 | -0.400 |
2021-03-31 | 2.122 | 0.095 | -0.683 |
2020-12-31 | 3.437 | 0.085 | -0.544 |
2020-09-30 | 11.242 | 0.078 | -0.686 |
2020-09-30 | 11.242 | 0.078 | -0.686 |
2020-09-30 | 11.242 | 0.078 | -0.686 |
OPEN Price Target
For more insight on analysts targets of OPEN, see our OPEN price target page. And for a list of of all stocks sorted by upside potential based on analyst target price, see our Top Price Target page.
Average Price Target | $31.20 | Average Broker Recommendation | 1.43 (Moderate Buy) |
Opendoor Technologies Inc. (OPEN) Company Bio
Opendoor Technologies Inc. provides digital platform for residential real estates. The Company develops service model for real estate buying and selling on a mobile device. Opendoor Technologies serves customers in the United States.
Latest OPEN News From Around the Web
Below are the latest news stories about OPENDOOR TECHNOLOGIES INC that investors may wish to consider to help them evaluate OPEN as an investment opportunity.
Why It’s Time to Bet Big on Housing StocksAll around us, stocks are soaring. |
Opendoor: The ‘Amazon of Houses’ Keeps Getting BetterAs this downturn ends and its operational metrics improve, Opendoor is positioned to grow like wildfire for the next 10-plus years. |
Despite Fast-paced Momentum, Opendoor Technologies Inc. (OPEN) Is Still a Bargain StockOpendoor Technologies Inc. (OPEN) could be a great choice for investors looking to buy stocks that have gained strong momentum recently but are still trading at reasonable prices. It is one of the several stocks that made it through our 'Fast-Paced Momentum at a Bargain' screen. |
Social Security: When Is the Best Time To Claim if You Truly Don’t Need the Money?Social Security benefits are supposed to supplement your retirement income rather than be a major source of it, but for many Americans that's not the case. Social Security: Proposal for $2,400 Extra... |
Is Opendoor Making a Turnaround?Opendoor's (NASDAQ: OPEN) results gave investors a little reason for optimism in the first quarter, and if a new buying model works as planned, this could be a great stock. In this video, Travis Hoium highlights what to like and what to be skeptical of in the results. |
OPEN Price Returns
1-mo | 78.26% |
3-mo | 83.58% |
6-mo | 32.26% |
1-year | N/A |
3-year | N/A |
5-year | N/A |
YTD | 112.07% |
2022 | -92.06% |
2021 | -35.72% |
2020 | N/A |
2019 | N/A |
2018 | N/A |
Loading social stream, please wait...