OptimizeRx Corporation (OPRX): Price and Financial Metrics
OPRX Price/Volume Stats
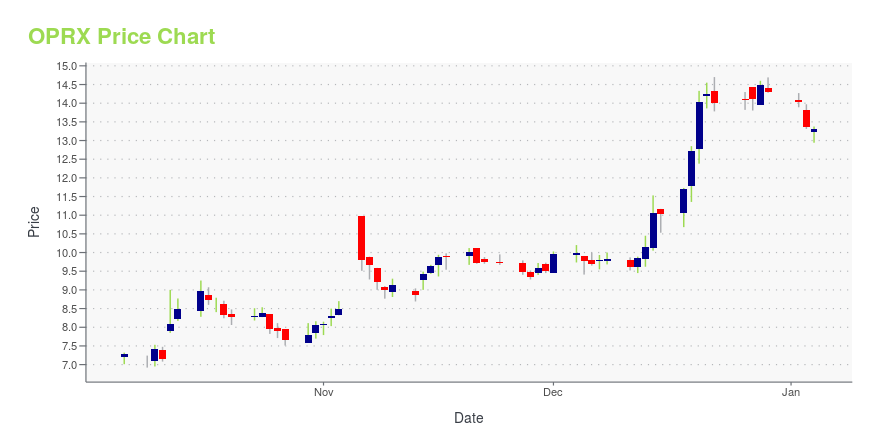
Current price | $9.96 | 52-week high | $20.55 |
Prev. close | $9.51 | 52-week low | $6.92 |
Day low | $9.46 | Volume | 235,400 |
Day high | $10.03 | Avg. volume | 177,306 |
50-day MA | $8.51 | Dividend yield | N/A |
200-day MA | $12.13 | Market Cap | 180.79M |
OPRX Stock Price Chart Interactive Chart >
OPRX POWR Grades
- Growth is the dimension where OPRX ranks best; there it ranks ahead of 94.43% of US stocks.
- OPRX's strongest trending metric is Sentiment; it's been moving up over the last 177 days.
- OPRX ranks lowest in Stability; there it ranks in the 12th percentile.
OPRX Stock Summary
- The ratio of debt to operating expenses for OPTIMIZERX CORP is higher than it is for about merely 3.59% of US stocks.
- Equity multiplier, or assets relative to shareholders' equity, comes in at 1.06 for OPTIMIZERX CORP; that's greater than it is for just 7.63% of US stocks.
- With a year-over-year growth in debt of -94.76%, OPTIMIZERX CORP's debt growth rate surpasses only 1.24% of about US stocks.
- Stocks that are quantitatively similar to OPRX, based on their financial statements, market capitalization, and price volatility, are WORX, CLOV, SGA, KAVL, and RVP.
- OPRX's SEC filings can be seen here. And to visit OPTIMIZERX CORP's official web site, go to www.optimizerx.com.
OPRX Valuation Summary
- In comparison to the median Healthcare stock, OPRX's price/sales ratio is 35.29% higher, now standing at 2.3.
- Over the past 65 months, OPRX's EV/EBIT ratio has gone up 12.
Below are key valuation metrics over time for OPRX.
Stock | Date | P/S | P/B | P/E | EV/EBIT |
---|---|---|---|---|---|
OPRX | 2023-11-03 | 2.3 | 1.2 | -9.8 | -9.2 |
OPRX | 2023-11-02 | 2.2 | 1.2 | -9.6 | -9.0 |
OPRX | 2023-11-01 | 2.2 | 1.2 | -9.4 | -8.7 |
OPRX | 2023-10-31 | 2.2 | 1.2 | -9.3 | -8.7 |
OPRX | 2023-10-30 | 2.1 | 1.1 | -9.0 | -8.3 |
OPRX | 2023-10-27 | 2.1 | 1.1 | -8.9 | -8.2 |
OPRX's Quality Factors
The “Quality” component of the POWR Ratings focuses on 31 different factors of a companies fundamentals and operational strength. Here are some key insights as we drill into the specifics of these quality attributes.- OPRX has a Quality Grade of C, ranking ahead of 30.75% of graded US stocks.
- OPRX's asset turnover comes in at 0.553 -- ranking 289th of 561 Business Services stocks.
- BCOV, GEG, and BBSI are the stocks whose asset turnover ratios are most correlated with OPRX.
The table below shows OPRX's key quality metrics over time.
Period | Asset Turnover | Gross Margin | ROIC |
---|---|---|---|
2021-06-30 | 0.553 | 0.556 | 0.063 |
2021-03-31 | 0.628 | 0.551 | -0.069 |
2020-12-31 | 0.761 | 0.557 | -0.329 |
2020-09-30 | 0.612 | 0.583 | -1.514 |
2020-06-30 | 0.529 | 0.591 | -2.408 |
2020-03-31 | 0.511 | 0.599 | -1.769 |
OPRX Price Target
For more insight on analysts targets of OPRX, see our OPRX price target page. And for a list of of all stocks sorted by upside potential based on analyst target price, see our Top Price Target page.
Average Price Target | $73.33 | Average Broker Recommendation | 1.4 (Strong Buy) |
OptimizeRx Corporation (OPRX) Company Bio
OptimizeRx Corporation operates an Internet website through which it offers advice to consumers on how to save money on branded prescription and over-the-counter healthcare products.
Latest OPRX News From Around the Web
Below are the latest news stories about OPTIMIZERX CORP that investors may wish to consider to help them evaluate OPRX as an investment opportunity.
Why OptimizeRx Corp. (OPRX) Might be Well Poised for a SurgeOptimizeRx Corp. (OPRX) shares have started gaining and might continue moving higher in the near term, as indicated by solid earnings estimate revisions. |
How Much Upside is Left in OptimizeRx Corp. (OPRX)? Wall Street Analysts Think 47.72%The mean of analysts' price targets for OptimizeRx Corp. (OPRX) points to a 47.7% upside in the stock. While this highly sought-after metric has not proven reasonably effective, strong agreement among analysts in raising earnings estimates does indicate an upside in the stock. |
Industry Analysts Just Made A Massive Upgrade To Their OptimizeRx Corporation (NASDAQ:OPRX) Revenue ForecastsOptimizeRx Corporation ( NASDAQ:OPRX ) shareholders will have a reason to smile today, with the analysts making... |
OptimizeRx Corporation (NASDAQ:OPRX) Q3 2023 Earnings Call TranscriptOptimizeRx Corporation (NASDAQ:OPRX) Q3 2023 Earnings Call Transcript November 6, 2023 Operator: Good morning, everyone and thank you for joining OptimizeRx’s Third Quarter Fiscal 2023 Earnings Discussion. With us today is the Chief Executive Officer of OptimizeRx, William Febbo. He is joined by company Chief Financial Officer, Ed Stelmakh; President Steve Silvestro; General Counsel Marion […] |
Q3 2023 OPTIMIZERx Corp Earnings CallQ3 2023 OPTIMIZERx Corp Earnings Call |
OPRX Price Returns
1-mo | 17.31% |
3-mo | N/A |
6-mo | -32.88% |
1-year | -50.67% |
3-year | -64.66% |
5-year | -38.18% |
YTD | -40.71% |
2022 | -72.95% |
2021 | 99.33% |
2020 | 203.41% |
2019 | -6.38% |
2018 | 598.73% |
Continue Researching OPRX
Here are a few links from around the web to help you further your research on OptimizeRx Corp's stock as an investment opportunity:OptimizeRx Corp (OPRX) Stock Price | Nasdaq
OptimizeRx Corp (OPRX) Stock Quote, History and News - Yahoo Finance
OptimizeRx Corp (OPRX) Stock Price and Basic Information | MarketWatch
Loading social stream, please wait...