Orla Mining Ltd. (ORLA): Price and Financial Metrics
GET POWR RATINGS... FREE!
ORLA POWR Grades
- Growth is the dimension where ORLA ranks best; there it ranks ahead of 88.7% of US stocks.
- The strongest trend for ORLA is in Growth, which has been heading up over the past 178 days.
- ORLA ranks lowest in Momentum; there it ranks in the 15th percentile.
ORLA Stock Summary
- ORLA's went public 2.24 years ago, making it older than only 9.63% of listed US stocks we're tracking.
- Over the past twelve months, ORLA has reported earnings growth of -299.5%, putting it ahead of just 5.34% of US stocks in our set.
- As for revenue growth, note that ORLA's revenue has grown 3,330.04% over the past 12 months; that beats the revenue growth of 99.74% of US companies in our set.
- Stocks that are quantitatively similar to ORLA, based on their financial statements, market capitalization, and price volatility, are ANGN, FRSX, PVCT, RYTM, and LNTH.
- To dig deeper into the stock's financial statements, go to ORLA's page on browse-edgar?action=getcompany&CIK=0001680056.
ORLA Valuation Summary
- ORLA's EV/EBIT ratio is 20.8; this is 95.31% higher than that of the median Basic Materials stock.
- ORLA's EV/EBIT ratio has moved up 68.6 over the prior 27 months.
Below are key valuation metrics over time for ORLA.
Stock | Date | P/S | P/B | P/E | EV/EBIT |
---|---|---|---|---|---|
ORLA | 2023-03-16 | 7.4 | 2.8 | 46.9 | 20.8 |
ORLA | 2023-03-15 | 8.0 | 3.0 | 51.1 | 22.6 |
ORLA | 2023-03-14 | 8.1 | 3.0 | 51.7 | 22.8 |
ORLA | 2023-03-13 | 8.0 | 3.0 | 50.6 | 22.4 |
ORLA | 2023-03-10 | 7.6 | 2.9 | 48.4 | 21.5 |
ORLA | 2023-03-09 | 7.5 | 2.8 | 47.9 | 21.3 |
ORLA's Quality Factors
The “Quality” component of the POWR Ratings focuses on 31 different factors of a companies fundamentals and operational strength. Here are some key insights as we drill into the specifics of these quality attributes.- ORLA has a Quality Grade of F, ranking ahead of 1.27% of graded US stocks.
- ORLA's asset turnover comes in at 0 -- ranking 31st of 47 Precious Metals stocks.
- 500 - Internal server error
The table below shows ORLA's key quality metrics over time.
Period | Asset Turnover | Gross Margin | ROIC |
---|---|---|---|
2021-06-30 | 0 | NA | -0.087 |
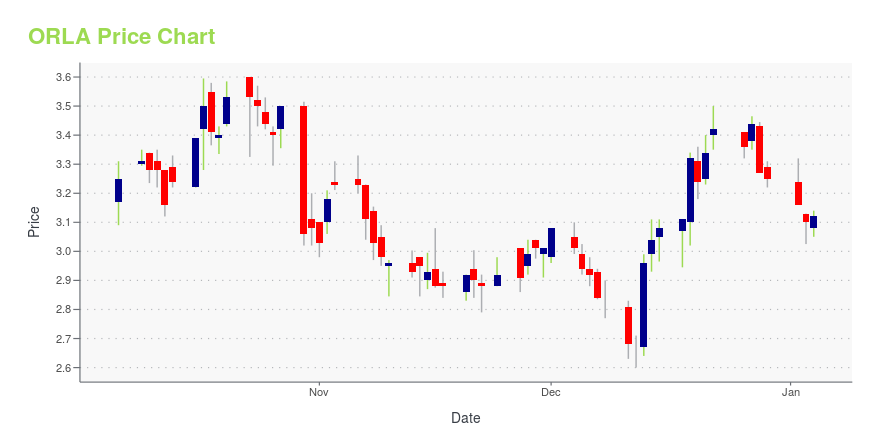
ORLA Stock Price Chart Interactive Chart >
ORLA Price/Volume Stats
Current price | $4.65 | 52-week high | $5.24 |
Prev. close | $4.66 | 52-week low | $2.30 |
Day low | $4.50 | Volume | 262,607 |
Day high | $4.65 | Avg. volume | 186,896 |
50-day MA | $4.19 | Dividend yield | N/A |
200-day MA | $3.57 | Market Cap | 1.42B |
Orla Mining Ltd. (ORLA) Company Bio
Orla Mining Ltd. of Canada operates as a mineral exploration company. The Company focuses on acquiring mineral exploration opportunities.
Latest ORLA News From Around the Web
Below are the latest news stories about ORLA MINING LTD that investors may wish to consider to help them evaluate ORLA as an investment opportunity.
Orla Mining reports Q4 earnings; raises FY23 outlook
|
Orla Mining Reports Fourth Quarter and Year End 2022 ResultsOrla Mining Ltd. (TSX: OLA) (NYSE: ORLA) ("Orla" or the "Company") today announces the results for the fourth quarter and year ended December 31, 2022. |
Orla Mining Advances Caballito and Pava Copper-Gold Sulphide Mineralized Zones at Cerro Quema Project, PanamaOrla Mining Ltd. (TSX: OLA) (NYSE: ORLA) ("Orla" or the "Company") is pleased to provide an update on its 2022 exploration activities on its Cerro Quema Project and an overview of exploration plans for 2023. |
Orla Mining Drills Significant Gold Intersections at Multiple Oxide Targets upon Reactivation of Exploration at South Railroad Project, NevadaOrla Mining Ltd. (TSX: OLA) (NYSE: ORLA) ("Orla" or the "Company") is pleased to provide an update on its exploration activities on its South Railroad Project ("South Railroad" or "the project") in 2022 and an overview of exploration plans for 2023 in Nevada. |
The 7 Most Promising Penny Stocks to Buy in FebruaryAlthough speculative trades should be left alone, these are the penny stocks to buy that even Wall Street can’t ignore. |
ORLA Price Returns
1-mo | 12.59% |
3-mo | 14.53% |
6-mo | 53.97% |
1-year | -2.31% |
3-year | 300.86% |
5-year | N/A |
YTD | 15.10% |
2022 | 5.76% |
2021 | -29.13% |
2020 | 247.16% |
2019 | N/A |
2018 | N/A |
Loading social stream, please wait...