O'Reilly Automotive Inc. (ORLY): Price and Financial Metrics
ORLY Price/Volume Stats
Current price | $980.52 | 52-week high | $1,005.96 |
Prev. close | $982.38 | 52-week low | $767.27 |
Day low | $978.28 | Volume | 321,670 |
Day high | $988.81 | Avg. volume | 420,951 |
50-day MA | $940.28 | Dividend yield | N/A |
200-day MA | $916.45 | Market Cap | 58.01B |
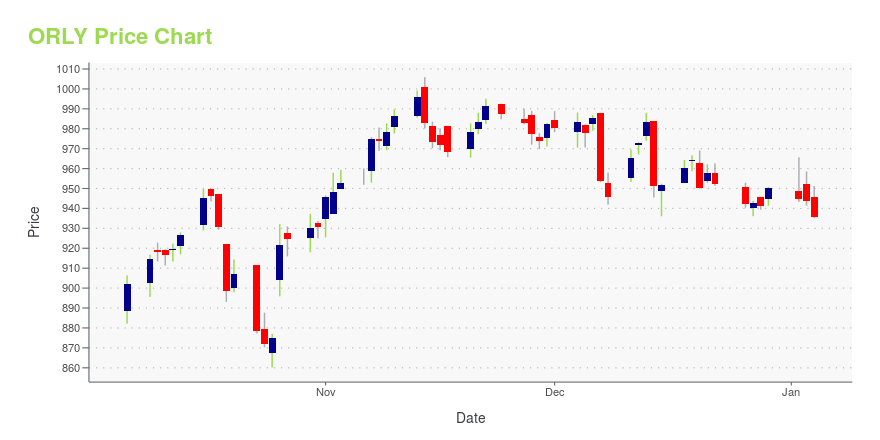
ORLY Stock Price Chart Interactive Chart >
ORLY POWR Grades
- ORLY scores best on the Quality dimension, with a Quality rank ahead of 99.65% of US stocks.
- ORLY's strongest trending metric is Growth; it's been moving down over the last 177 days.
- ORLY ranks lowest in Value; there it ranks in the 21st percentile.
ORLY Stock Summary
- ORLY has a higher market value than 96.14% of US stocks; more precisely, its current market capitalization is $58,346,920,228.
- O REILLY AUTOMOTIVE INC's capital turnover -- a measure of revenue relative to shareholder's equity -- is better than merely 1.85% of US listed stocks.
- Equity multiplier, or assets relative to shareholders' equity, comes in at -8.63 for O REILLY AUTOMOTIVE INC; that's greater than it is for just 2.48% of US stocks.
- Stocks that are quantitatively similar to ORLY, based on their financial statements, market capitalization, and price volatility, are AZO, MNST, MO, CTAS, and INFY.
- Visit ORLY's SEC page to see the company's official filings. To visit the company's web site, go to www.oreillyauto.com.
ORLY Valuation Summary
- ORLY's price/sales ratio is 3.6; this is 414.29% higher than that of the median Consumer Cyclical stock.
- ORLY's EV/EBIT ratio has moved up 4.3 over the prior 243 months.
Below are key valuation metrics over time for ORLY.
Stock | Date | P/S | P/B | P/E | EV/EBIT |
---|---|---|---|---|---|
ORLY | 2023-10-20 | 3.6 | -33.6 | 24.2 | 20.1 |
ORLY | 2023-10-19 | 3.6 | -33.3 | 24.0 | 19.9 |
ORLY | 2023-10-18 | 3.7 | -34.5 | 24.8 | 20.5 |
ORLY | 2023-10-17 | 3.7 | -35.0 | 25.2 | 20.8 |
ORLY | 2023-10-16 | 3.7 | -35.0 | 25.2 | 20.8 |
ORLY | 2023-10-13 | 3.7 | -34.3 | 24.7 | 20.5 |
ORLY Growth Metrics
- Its 5 year cash and equivalents growth rate is now at 942.4%.
- The 2 year cash and equivalents growth rate now stands at -33.27%.
- Its 2 year net income to common stockholders growth rate is now at 56.53%.

The table below shows ORLY's growth in key financial areas (numbers in millions of US dollars).
Date | Revenue | Operating Cash Flow | Net Income to Common Stock |
---|---|---|---|
2022-09-30 | 14,056.86 | 2,995.003 | 2,163.051 |
2022-06-30 | 13,737.81 | 2,886.451 | 2,136.265 |
2022-03-31 | 13,532.67 | 3,006.524 | 2,144.956 |
2021-12-31 | 13,327.56 | 3,207.31 | 2,164.685 |
2021-09-30 | 12,864.84 | 3,052.801 | 2,038.657 |
2021-06-30 | 12,592.91 | 2,990.357 | 2,007.257 |
ORLY's Quality Factors
The “Quality” component of the POWR Ratings focuses on 31 different factors of a companies fundamentals and operational strength. Here are some key insights as we drill into the specifics of these quality attributes.- ORLY has a Quality Grade of A, ranking ahead of 99.87% of graded US stocks.
- ORLY's asset turnover comes in at 1.052 -- ranking 133rd of 165 Retail stocks.
- AAP, SCVL, and RH are the stocks whose asset turnover ratios are most correlated with ORLY.
The table below shows ORLY's key quality metrics over time.
Period | Asset Turnover | Gross Margin | ROIC |
---|---|---|---|
2021-06-30 | 1.052 | 0.526 | 0.255 |
2021-03-31 | 1.025 | 0.526 | 0.247 |
2020-12-31 | 0.989 | 0.524 | 0.216 |
2020-09-30 | 0.978 | 0.527 | 0.208 |
2020-06-30 | 0.976 | 0.530 | 0.193 |
2020-03-31 | 0.964 | 0.530 | 0.172 |
ORLY Price Target
For more insight on analysts targets of ORLY, see our ORLY price target page. And for a list of of all stocks sorted by upside potential based on analyst target price, see our Top Price Target page.
Average Price Target | $652.07 | Average Broker Recommendation | 1.65 (Moderate Buy) |
O'Reilly Automotive Inc. (ORLY) Company Bio
O’Reilly Auto Parts is an American auto parts retailer that provides automotive aftermarket parts, tools, supplies, equipment, and accessories in the United States serving both the professional service providers and do-it-yourself customers. Founded in 1957 by the O’Reilly family, the company operates more than 5,600 stores in 47 states, and 22 ORMA stores in Mexico. (Source:Wikipedia)
Latest ORLY News From Around the Web
Below are the latest news stories about O REILLY AUTOMOTIVE INC that investors may wish to consider to help them evaluate ORLY as an investment opportunity.
Why O'Reilly Automotive (ORLY) is a Top Momentum Stock for the Long-TermWhether you're a value, growth, or momentum investor, finding strong stocks becomes easier with the Zacks Style Scores, a top feature of the Zacks Premium research service. |
If You Invested $1000 in O'Reilly Automotive 10 Years Ago, This Is How Much You'd Have NowHolding on to popular or trending stocks for the long-term can make your portfolio a winner. |
Here's Why O'Reilly Automotive (ORLY) is a Strong Growth StockWhether you're a value, growth, or momentum investor, finding strong stocks becomes easier with the Zacks Style Scores, a top feature of the Zacks Premium research service. |
Goldman Sachs sees limited upside to stocks in 2024 as market ralliesGoldman Sachs sees the majority of the S&P 500's gains for 2024 coming late in the year when investors get clarity on the timing of rate cuts and US elections conclude. |
Is O'Reilly Automotive (ORLY) Stock Outpacing Its Retail-Wholesale Peers This Year?Here is how O'Reilly Automotive (ORLY) and Rover Group, Inc. (ROVR) have performed compared to their sector so far this year. |
ORLY Price Returns
1-mo | 3.69% |
3-mo | 3.49% |
6-mo | 9.51% |
1-year | 14.39% |
3-year | 116.18% |
5-year | 182.75% |
YTD | 16.17% |
2022 | 19.51% |
2021 | 56.05% |
2020 | 3.27% |
2019 | 27.28% |
2018 | 43.15% |
Continue Researching ORLY
Want to do more research on O Reilly Automotive Inc's stock and its price? Try the links below:O Reilly Automotive Inc (ORLY) Stock Price | Nasdaq
O Reilly Automotive Inc (ORLY) Stock Quote, History and News - Yahoo Finance
O Reilly Automotive Inc (ORLY) Stock Price and Basic Information | MarketWatch
Loading social stream, please wait...