Orion Group Holdings, Inc. Common (ORN): Price and Financial Metrics
ORN Price/Volume Stats
Current price | $5.36 | 52-week high | $5.49 |
Prev. close | $5.26 | 52-week low | $2.10 |
Day low | $5.29 | Volume | 163,100 |
Day high | $5.49 | Avg. volume | 99,607 |
50-day MA | $4.22 | Dividend yield | N/A |
200-day MA | $3.05 | Market Cap | 173.79M |
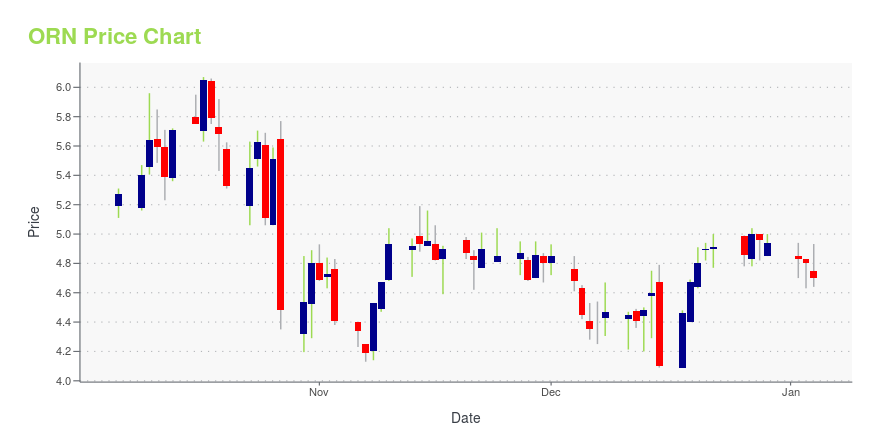
ORN Stock Price Chart Interactive Chart >
ORN POWR Grades
- ORN scores best on the Sentiment dimension, with a Sentiment rank ahead of 98.59% of US stocks.
- ORN's strongest trending metric is Sentiment; it's been moving up over the last 177 days.
- ORN's current lowest rank is in the Growth metric (where it is better than 11.04% of US stocks).
ORN Stock Summary
- ORION GROUP HOLDINGS INC's capital turnover -- a measure of revenue relative to shareholder's equity -- is better than 92.39% of US listed stocks.
- Of note is the ratio of ORION GROUP HOLDINGS INC's sales and general administrative expense to its total operating expenses; 99.31% of US stocks have a lower such ratio.
- With a price/sales ratio of 0.24, ORION GROUP HOLDINGS INC has a higher such ratio than merely 8.34% of stocks in our set.
- Stocks that are quantitatively similar to ORN, based on their financial statements, market capitalization, and price volatility, are FDP, NAII, MATX, EBF, and TRS.
- ORN's SEC filings can be seen here. And to visit ORION GROUP HOLDINGS INC's official web site, go to www.oriongroupholdingsinc.com.
ORN Valuation Summary
- In comparison to the median Industrials stock, ORN's EV/EBIT ratio is 243.31% lower, now standing at -22.5.
- ORN's price/earnings ratio has moved down 42.5 over the prior 192 months.
Below are key valuation metrics over time for ORN.
Stock | Date | P/S | P/B | P/E | EV/EBIT |
---|---|---|---|---|---|
ORN | 2023-09-19 | 0.2 | 1.3 | -9.4 | -22.5 |
ORN | 2023-09-18 | 0.2 | 1.3 | -9.5 | -22.6 |
ORN | 2023-09-15 | 0.2 | 1.3 | -9.1 | -21.8 |
ORN | 2023-09-14 | 0.2 | 1.2 | -9.0 | -21.7 |
ORN | 2023-09-13 | 0.2 | 1.2 | -8.6 | -21.0 |
ORN | 2023-09-12 | 0.2 | 1.2 | -8.9 | -21.5 |
ORN Growth Metrics
- Its 2 year cash and equivalents growth rate is now at -50.26%.
- Its 4 year cash and equivalents growth rate is now at 772.39%.
- The 3 year net income to common stockholders growth rate now stands at 80.89%.

The table below shows ORN's growth in key financial areas (numbers in millions of US dollars).
Date | Revenue | Operating Cash Flow | Net Income to Common Stock |
---|---|---|---|
2022-09-30 | 714.396 | 4.93 | -16.486 |
2022-06-30 | 671.682 | 0.47 | -26.928 |
2022-03-31 | 622.982 | 1.011 | -20.344 |
2021-12-31 | 601.36 | 0.069 | -14.56 |
2021-09-30 | 609.267 | 11.896 | -2.071 |
2021-06-30 | 658.793 | 24.233 | 19.927 |
ORN's Quality Factors
The “Quality” component of the POWR Ratings focuses on 31 different factors of a companies fundamentals and operational strength. Here are some key insights as we drill into the specifics of these quality attributes.- ORN has a Quality Grade of C, ranking ahead of 56.67% of graded US stocks.
- ORN's asset turnover comes in at 1.562 -- ranking 11th of 51 Construction stocks.
- AGX, DY, and GVA are the stocks whose asset turnover ratios are most correlated with ORN.
The table below shows ORN's key quality metrics over time.
Period | Asset Turnover | Gross Margin | ROIC |
---|---|---|---|
2021-09-30 | 1.562 | 0.092 | 0.017 |
2021-06-30 | 1.673 | 0.109 | 0.096 |
2021-03-31 | 1.783 | 0.115 | 0.086 |
2020-12-31 | 1.829 | 0.119 | 0.090 |
2020-09-30 | 1.929 | 0.111 | 0.080 |
2020-06-30 | 1.962 | 0.107 | 0.056 |
ORN Price Target
For more insight on analysts targets of ORN, see our ORN price target page. And for a list of of all stocks sorted by upside potential based on analyst target price, see our Top Price Target page.
Average Price Target | $7.50 | Average Broker Recommendation | 1.75 (Moderate Buy) |
Orion Group Holdings, Inc. Common (ORN) Company Bio
Orion Group Holdings, Inc. operates as a marine specialty contractor serving the heavy civil marine infrastructure market. The company provides marine construction and specialty services on, over, and under the water in the continental United States, Alaska, Canada, and the Caribbean Basin. The company was founded in 1994 and is based in Houston, Texas.
Latest ORN News From Around the Web
Below are the latest news stories about ORION GROUP HOLDINGS INC that investors may wish to consider to help them evaluate ORN as an investment opportunity.
Strength Seen in Orion Marine (ORN): Can Its 5.4% Jump Turn into More Strength?Orion Marine (ORN) saw its shares surge in the last session with trading volume being higher than average. The latest trend in earnings estimate revisions may not translate into further price increase in the near term. |
Orion Group Holdings, Inc.'s (NYSE:ORN) large institutional owners must be happy as stock continues to impress, up 11% over the past weekKey Insights Given the large stake in the stock by institutions, Orion Group Holdings' stock price might be vulnerable... |
Sidoti Events, LLC’s Virtual September Small-Cap ConferenceSidoti Events, LLC, an affiliate of Sidoti & Company, LLC, has released the presentation schedule and weblinks for its two-day September Small-Cap Conference taking place Wednesday and Thursday, September 20-21, 2023. The presentation schedule is subject to change. |
Orion Group Holdings, Inc. to Present at Sidoti Virtual Investor Conference on September 21HOUSTON, Sept. 14, 2023 (GLOBE NEWSWIRE) -- Orion Group Holdings, Inc. (NYSE: ORN) (the “Company”), a leading specialty construction company, announced today that CEO Travis Boone and CFO Scott Thanisch will participate in the Sidoti September Virtual Investor Conference on September 20 and September 21, 2023. Orion Group Holdings, Inc. will present on Thursday, September 21, from 12:15 p.m. to 12:45 p.m. Eastern Time, and management will also meet virtually with investors during the two-day con |
Orion Group Holdings Executive VP Acquires 15% More StockEven if it's not a huge purchase, we think it was good to see that Gordon Thanisch, the Executive VP of Orion Group... |
ORN Price Returns
1-mo | 11.67% |
3-mo | 90.75% |
6-mo | 107.75% |
1-year | 103.03% |
3-year | 94.91% |
5-year | -25.56% |
YTD | 125.21% |
2022 | -36.87% |
2021 | -23.99% |
2020 | -4.43% |
2019 | 20.98% |
2018 | -45.21% |
Continue Researching ORN
Want to do more research on Orion Group Holdings Inc's stock and its price? Try the links below:Orion Group Holdings Inc (ORN) Stock Price | Nasdaq
Orion Group Holdings Inc (ORN) Stock Quote, History and News - Yahoo Finance
Orion Group Holdings Inc (ORN) Stock Price and Basic Information | MarketWatch
Loading social stream, please wait...