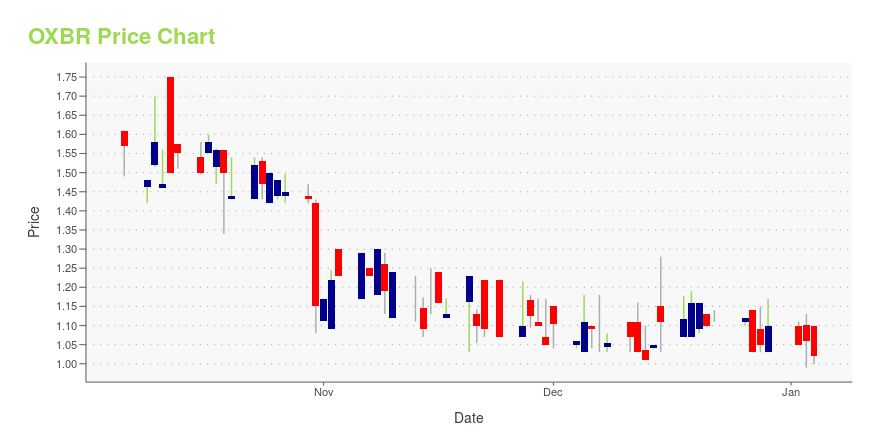
Oxbridge Re Holdings Limited - Ordinary Shares (OXBR): Price and Financial Metrics
OXBR Price/Volume Stats
| Current price | $2.95 | 52-week high | $3.72 |
| Prev. close | $3.42 | 52-week low | $0.87 |
| Day low | $2.80 | Volume | 82,806 |
| Day high | $3.49 | Avg. volume | 24,509 |
| 50-day MA | $2.42 | Dividend yield | N/A |
| 200-day MA | $1.45 | Market Cap | 17.72M |
OXBR Stock Price Chart Interactive Chart >
Latest OXBR News From Around the Web
Below are the latest news stories about OXBRIDGE RE HOLDINGS LTD that investors may wish to consider to help them evaluate OXBR as an investment opportunity.
Oxbridge Re Holdings Limited (NASDAQ:OXBR) Q3 2023 Earnings Call TranscriptOxbridge Re Holdings Limited (NASDAQ:OXBR) Q3 2023 Earnings Call Transcript November 14, 2023 Operator: Good afternoon. Welcome to Oxbridge Re’s Third Quarter 2023 Earnings Call. My name is David, and I’ll be your conference operator this afternoon. [Operator Instructions] Joining us for today’s presentation is Oxbridge Re’s Chairman, President and Chief Executive Officer, Jay Madhu; […] |
Oxbridge Re Holdings Limited Reports Third Quarter 2023 ResultsGRAND CAYMAN, Cayman Islands, Nov. 14, 2023 (GLOBE NEWSWIRE) -- Oxbridge Re Holdings Limited (NASDAQ: OXBR), (the “Company”), and its subsidiaries which are engaged in the business of tokenized Real World Assets (“RWAs”), initially in the form of Tokenized Reinsurance Securities, and reinsurance business solutions to property and casualty insurers, reported its results for the three and nine months ended September 30, 2023. “We are pleased with our operational performance this year and the issua |
Oxbridge Re Announces 2023 Third Quarter Results on November 14, 2023GRAND CAYMAN, Cayman Islands, Nov. 07, 2023 (GLOBE NEWSWIRE) -- Oxbridge Re (NASDAQ: OXBR) announced that it plans to hold a conference call on Tuesday November 14, 2023 at 4:30 p.m. Eastern time to discuss results for the third quarter and nine months ending ended September 30, 2023. Financial results will be issued in a press release after the close of the market on the same day. Oxbridge Re’s management will host the conference call, followed by a question and answer period. Interested partie |
Oxbridge Re Joins Webull’s Corporate Connect ServiceGRAND CAYMAN, Cayman Islands, Oct. 10, 2023 (GLOBE NEWSWIRE) -- Oxbridge Re (NASDAQ: OXBR), (the “Company”), today announced that it has begun participating on the Webull Corporate Connect Service. The Oxbridge Re page on the Webull Corporate Connect Service will provide real-time Company updates, important announcements, and other relevant content such as news, earnings reports, investor presentations, and more. “We are eager to join Webull Corporate Connect Service to enhance transparency and |
Oxbridge Re Holdings to Present at the LD Micro Main Event XVIPresentation on Wednesday, October 4th at 12:00 PT Grand Cayman, Cayman Islands--(Newsfile Corp. - September 19, 2023) - Oxbridge Re Holdings Ltd (NASDAQ: OXBR) announced today that it will be presenting at the 16th annual Main Event on Wednesday, October 4th at 12:00 PT at the Luxe Sunset Boulevard Hotel. Jay Madhu, CEO and Chairman, will be leading the presentation. "We know what this event means to our industry and how much ... |
OXBR Price Returns
| 1-mo | 20.90% |
| 3-mo | 180.95% |
| 6-mo | 195.00% |
| 1-year | 62.09% |
| 3-year | -13.49% |
| 5-year | 183.65% |
| YTD | 168.18% |
| 2023 | -8.33% |
| 2022 | -78.65% |
| 2021 | 200.53% |
| 2020 | 151.01% |
| 2019 | 18.25% |
Continue Researching OXBR
Want to do more research on OXBRIDGE RE HOLDINGS Ltd's stock and its price? Try the links below:OXBRIDGE RE HOLDINGS Ltd (OXBR) Stock Price | Nasdaq
OXBRIDGE RE HOLDINGS Ltd (OXBR) Stock Quote, History and News - Yahoo Finance
OXBRIDGE RE HOLDINGS Ltd (OXBR) Stock Price and Basic Information | MarketWatch


Loading social stream, please wait...