Oxford Industries, Inc. (OXM): Price and Financial Metrics

Oxford Industries, Inc. (OXM): $112.40

0.07 (-0.06%)

POWR Rating

Component Grades

Momentum

C

Stability

C

Sentiment

Quality

B

Add OXM to Watchlist
Sign Up

Industry: Fashion & Luxury

Industry

B

Ranked

#35 of 61

in industry

OXM Price/Volume Stats
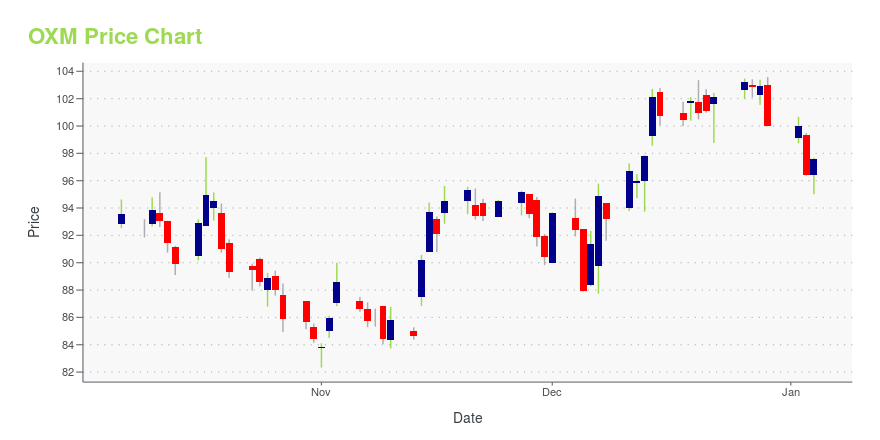
Current price $112.40 52-week high $113.88
Prev. close $112.47 52-week low $82.33
Day low $111.57 Volume 308,200
Day high $113.88 Avg. volume 174,266
50-day MA $101.31 Dividend yield 2.37%
200-day MA $98.33 Market Cap 1.76B

OXM Stock Price Chart Interactive Chart >

OXM POWR Grades

  • OXM scores best on the Value dimension, with a Value rank ahead of 89.93% of US stocks.
  • The strongest trend for OXM is in Growth, which has been heading down over the past 26 weeks.
  • OXM ranks lowest in Sentiment; there it ranks in the 5th percentile.

OXM Stock Summary

  • OXFORD INDUSTRIES INC's stock had its IPO on December 30, 1987, making it an older stock than 89.95% of US equities in our set.
  • Of note is the ratio of OXFORD INDUSTRIES INC's sales and general administrative expense to its total operating expenses; 98.31% of US stocks have a lower such ratio.
  • In terms of volatility of its share price, OXM is more volatile than merely 12.19% of stocks we're observing.
  • Stocks with similar financial metrics, market capitalization, and price volatility to OXFORD INDUSTRIES INC are BOOT, CRI, MYE, GRBK, and RELL.
  • Visit OXM's SEC page to see the company's official filings. To visit the company's web site, go to www.oxfordinc.com.

OXM Valuation Summary

  • OXM's EV/EBIT ratio is 9.4; this is 38.56% lower than that of the median Consumer Cyclical stock.
  • Over the past 243 months, OXM's price/sales ratio has gone up 0.3.

Below are key valuation metrics over time for OXM.

Stock Date P/S P/B P/E EV/EBIT
OXM 2023-12-29 1 2.5 10.2 9.4
OXM 2023-12-28 1 2.6 10.5 9.7
OXM 2023-12-27 1 2.6 10.5 9.7
OXM 2023-12-26 1 2.6 10.6 9.7
OXM 2023-12-22 1 2.5 10.4 9.6
OXM 2023-12-21 1 2.5 10.3 9.5

OXM Growth Metrics

    Its 3 year cash and equivalents growth rate is now at 478.06%.
  • The 2 year net cashflow from operations growth rate now stands at 118.44%.
  • The 4 year cash and equivalents growth rate now stands at 2673.5%.
Over the past 15 months, OXM's revenue has gone up $338,024,000.

The table below shows OXM's growth in key financial areas (numbers in millions of US dollars).

Date Revenue Operating Cash Flow Net Income to Common Stock
2022-09-30 1,328.96 127.176 159.094
2022-06-30 1,263.656 139.65 165.413
2022-03-31 1,228.898 179.481 160.261
2021-12-31 1,142.079 198.006 131.321
2021-09-30 1,063.53 218.258 93.696
2021-06-30 990.936 208.511 57.107

OXM's Quality Factors

The “Quality” component of the POWR Ratings focuses on 31 different factors of a companies fundamentals and operational strength. Here are some key insights as we drill into the specifics of these quality attributes.
  • OXM has a Quality Grade of A, ranking ahead of 98.73% of graded US stocks.
  • OXM's asset turnover comes in at 1.101 -- ranking 12th of 32 Apparel stocks.
  • GES, SKX, and CRI are the stocks whose asset turnover ratios are most correlated with OXM.

The table below shows OXM's key quality metrics over time.

Period Asset Turnover Gross Margin ROIC
2021-07-31 1.101 0.598 0.101
2021-05-01 0.944 0.571 -0.004
2021-01-30 0.785 0.554 -0.139
2020-10-31 0.828 0.559 -0.092
2020-08-01 0.870 0.559 -0.073
2020-05-02 0.964 0.573 -0.022

OXM Price Target

For more insight on analysts targets of OXM, see our OXM price target page. And for a list of of all stocks sorted by upside potential based on analyst target price, see our Top Price Target page.

Average Price Target $123.40 Average Broker Recommendation 1.7 (Moderate Buy)

Oxford Industries, Inc. (OXM) Company Bio


Oxford Industries, Inc., an apparel company, designs, sources, markets, and distributes products of company owned lifestyle brands, and licensed and private labels apparel products worldwide. The company was founded in 1942 and is based in Atlanta, Georgia.


OXM Latest News Stream


Event/Time News Detail
Loading, please wait...

OXM Latest Social Stream


Loading social stream, please wait...

View Full OXM Social Stream

Latest OXM News From Around the Web

Below are the latest news stories about OXFORD INDUSTRIES INC that investors may wish to consider to help them evaluate OXM as an investment opportunity.

Oxford: Owner of Tommy Bahama, Lilly Pulitzer and Johnny Was to Participate in the ICR Conference 2024

ATLANTA, Dec. 27, 2023 (GLOBE NEWSWIRE) -- Oxford Industries, Inc. (NYSE: OXM) today announced the Company will be presenting at the ICR Conference 2024 being held at the JW Marriott Orlando Grande Lakes in Orlando, Florida. Tom Chubb, Chairman, CEO and President of Oxford will present at 10:00 a.m. Eastern Time on Tuesday, January 9, 2024. The presentation will be webcast and can be accessed via the Oxford website at www.oxfordinc.com. About OxfordOxford Industries, Inc., a leader in the appare

Yahoo | December 27, 2023

Is Oxford Industries (OXM) an Attractive Investment Choice?

ClearBridge Investments, an investment management company, released its “ClearBridge Small Cap Value Strategy” third quarter 2023 investor letter. A copy of the same can be downloaded here. The strategy outperformed the benchmark Russell 2000 Value Index in the third quarter. The strategy generated gains across three of the 11 sectors in which it was invested during […]

Yahoo | December 19, 2023

Insider Sell Alert: EVP Scott Grassmyer Sells 1,500 Shares of Oxford Industries Inc (OXM)

In the realm of stock market movements, insider trading activity is often a significant indicator that investors keep a close eye on.

Yahoo | December 15, 2023

Are Strong Financial Prospects The Force That Is Driving The Momentum In Oxford Industries, Inc.'s NYSE:OXM) Stock?

Oxford Industries (NYSE:OXM) has had a great run on the share market with its stock up by a significant 16% over the...

Yahoo | December 14, 2023

Company News for Dec 8, 2023

Companies In The Article Are: CIEN,MRK,VRNT,OXM

Yahoo | December 8, 2023

Read More 'OXM' Stories Here

OXM Price Returns

1-mo 11.47%
3-mo 13.17%
6-mo 18.55%
1-year 12.31%
3-year 39.63%
5-year 66.55%
YTD 13.17%
2023 10.03%
2022 -6.08%
2021 57.54%
2020 -11.15%
2019 8.27%

OXM Dividends

Ex-Dividend Date Type Payout Amount Change
Loading, please wait...
View Full OXM Dividend History

Continue Researching OXM

Here are a few links from around the web to help you further your research on Oxford Industries Inc's stock as an investment opportunity:

Oxford Industries Inc (OXM) Stock Price | Nasdaq
Oxford Industries Inc (OXM) Stock Quote, History and News - Yahoo Finance
Oxford Industries Inc (OXM) Stock Price and Basic Information | MarketWatch

Get Free Updates

Join thousands of investors who get the latest news, insights and top rated picks from StockNews.com!