
Pampa Energia S.A. (PAM): Price and Financial Metrics
PAM Price/Volume Stats
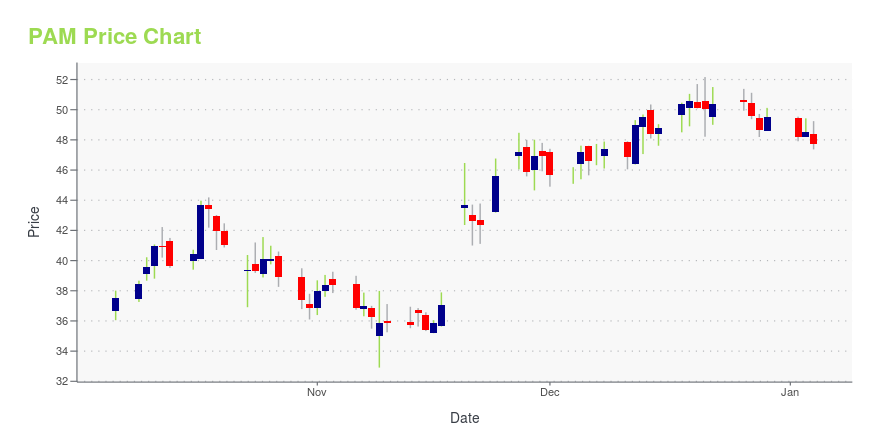
| Current price | $46.06 | 52-week high | $52.17 |
| Prev. close | $45.64 | 52-week low | $32.91 |
| Day low | $45.50 | Volume | 92,606 |
| Day high | $46.60 | Avg. volume | 272,801 |
| 50-day MA | $45.90 | Dividend yield | N/A |
| 200-day MA | $44.59 | Market Cap | 2.51B |
PAM Stock Price Chart Interactive Chart >
Pampa Energia S.A. (PAM) Company Bio
Pampa Energia S.A. engages in the electricity generation, transmission, and distribution in Argentina. The company was founded in 1945 and is based in Buenos Aires, Argentina.
Latest PAM News From Around the Web
Below are the latest news stories about PAMPA ENERGY INC that investors may wish to consider to help them evaluate PAM as an investment opportunity.
Global Conflicts Stir Sleeping Energy Giant in South AmericaAÑELO, Argentina—South America has long been the world’s sleeping energy giant, with massive oil-and-gas reserves still untapped. Now it is rumbling awake, with huge implications for the global market. From the deep waters off the northern shoulder of the continent down to Patagonia, a number of countries in the region are ramping up oil-and-gas production even as developed economies race to cut carbon emissions and reduce their dependence on fossil fuels. |
Argentina elected chainsaw-toting ‘king of the jungle’ Janvier Milei president — these are the companies to watch ahead of the coming economic ‘shock'The far-right leader is on a mission to prevent “the worst crisis" in the country's history. |
Hurry! 3 Argentine Stocks to Buy Before the New President Takes OfficeThese deeply-discounted Argentine stocks could see a massive surge under president-elect Milei's promised pro-business reforms. |
Why Are U.S.-Traded Argentina Stocks Up Today?Argentina has elected far-right libertarian Javier Milei as its President. |
Pampa Energía S.A. (NYSE:PAM) Q3 2023 Earnings Call TranscriptPampa Energía S.A. (NYSE:PAM) Q3 2023 Earnings Call Transcript November 9, 2023 Operator: We would like to welcome everyone to Pampa Energía’s Third quarter 2023 Results Video Conference. We inform you that this event is being recorded. [Operator Instructions]. Before proceeding, please read the disclaimer on the second page of our presentation. Let me mention […] |
PAM Price Returns
| 1-mo | 5.33% |
| 3-mo | 4.59% |
| 6-mo | -7.77% |
| 1-year | 11.69% |
| 3-year | 177.30% |
| 5-year | 37.45% |
| YTD | -6.99% |
| 2023 | 55.04% |
| 2022 | 51.30% |
| 2021 | 53.19% |
| 2020 | -16.13% |
| 2019 | -48.35% |
Continue Researching PAM
Want to do more research on Pampa Energy Inc's stock and its price? Try the links below:Pampa Energy Inc (PAM) Stock Price | Nasdaq
Pampa Energy Inc (PAM) Stock Quote, History and News - Yahoo Finance
Pampa Energy Inc (PAM) Stock Price and Basic Information | MarketWatch
Loading social stream, please wait...