
Park City Group, Inc. (PCYG): Price and Financial Metrics
PCYG Price/Volume Stats
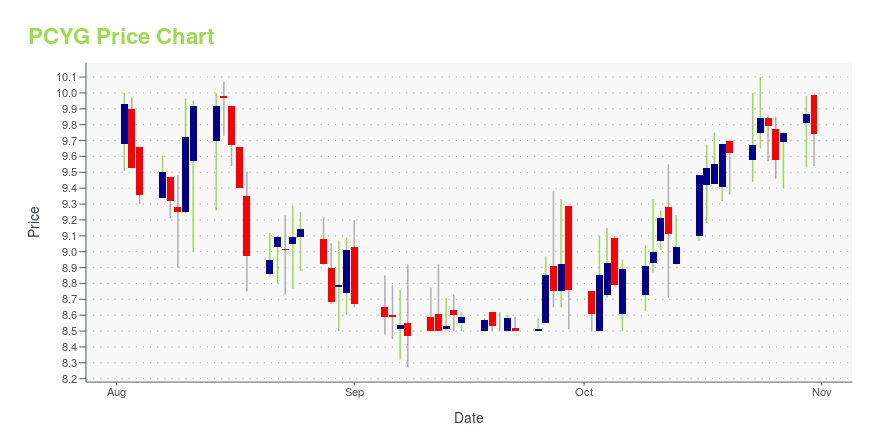
| Current price | $9.80 | 52-week high | $10.50 |
| Prev. close | $9.74 | 52-week low | $4.80 |
| Day low | $9.66 | Volume | 26,400 |
| Day high | $9.98 | Avg. volume | 32,501 |
| 50-day MA | $9.00 | Dividend yield | 0.61% |
| 200-day MA | $7.89 | Market Cap | 178.12M |
PCYG Stock Price Chart Interactive Chart >
Park City Group, Inc. (PCYG) Company Bio
Park City Group, Inc., a software-as-a-service provider, designs, develops, markets, and supports proprietary software products for the consumer goods supply chain. The company was founded in 1990 and is based in Salt Lake City, Utah.
Latest PCYG News From Around the Web
Below are the latest news stories about PARK CITY GROUP INC that investors may wish to consider to help them evaluate PCYG as an investment opportunity.
ReposiTrak Traceability Network Adds East Coast Seafood SuppliersSALT LAKE CITY, October 24, 2023--Leading FSMA 204 food traceability platform continues to expand market share, signs two new seafood suppliers |
ReposiTrak Traceability Network Adds Herb and Leafy Greens Supplier and Fresh Vegetable SupplierSALT LAKE CITY, October 19, 2023--Leading FSMA 204 food traceability platform expands market share, signs supplier of fresh herbs and leafy greens and third-generation vegetable grower |
Park City Group to Transfer Listing to New York Stock Exchange, Trading Ticker: TRAKSALT LAKE CITY, October 18, 2023--New Ticker Symbol and Exchange Represents First Step in Corporate Rebranding from Park City Group to ReposiTrak |
ReposiTrak Food Traceability Platforms Takes Off, Grows to 400 Supplier Connections and 1,500 SKUsSALT LAKE CITY, October 17, 2023--Others are talking about FSMA 204 food traceability, but ReposiTrak is doing it through the automated, proven and inexpensive ReposiTrak Network |
ReposiTrak Traceability Network Adds First Fresh-Cut Produce Supplier and Nut Butter SupplierSALT LAKE CITY, October 10, 2023--The growing FSMA 204 food traceability platform has signed suppliers of fresh-cut vegetables and nut butters. |
PCYG Price Returns
| 1-mo | N/A |
| 3-mo | N/A |
| 6-mo | N/A |
| 1-year | 4.66% |
| 3-year | 72.64% |
| 5-year | 93.93% |
| YTD | N/A |
| 2023 | 0.00% |
| 2022 | -14.39% |
| 2021 | 21.09% |
| 2020 | -5.34% |
| 2019 | -15.24% |
PCYG Dividends
| Ex-Dividend Date | Type | Payout Amount | Change | ||||||
|---|---|---|---|---|---|---|---|---|---|
| Loading, please wait... | |||||||||
Continue Researching PCYG
Want to see what other sources are saying about Park City Group Inc's financials and stock price? Try the links below:Park City Group Inc (PCYG) Stock Price | Nasdaq
Park City Group Inc (PCYG) Stock Quote, History and News - Yahoo Finance
Park City Group Inc (PCYG) Stock Price and Basic Information | MarketWatch
Loading social stream, please wait...