
Pineapple Holdings, Inc. (PEGY): Price and Financial Metrics
PEGY Price/Volume Stats
| Current price | $1.37 | 52-week high | $20.10 |
| Prev. close | $1.38 | 52-week low | $0.62 |
| Day low | $1.35 | Volume | 589,900 |
| Day high | $1.46 | Avg. volume | 3,328,325 |
| 50-day MA | $1.95 | Dividend yield | N/A |
| 200-day MA | $4.72 | Market Cap | 9.92M |
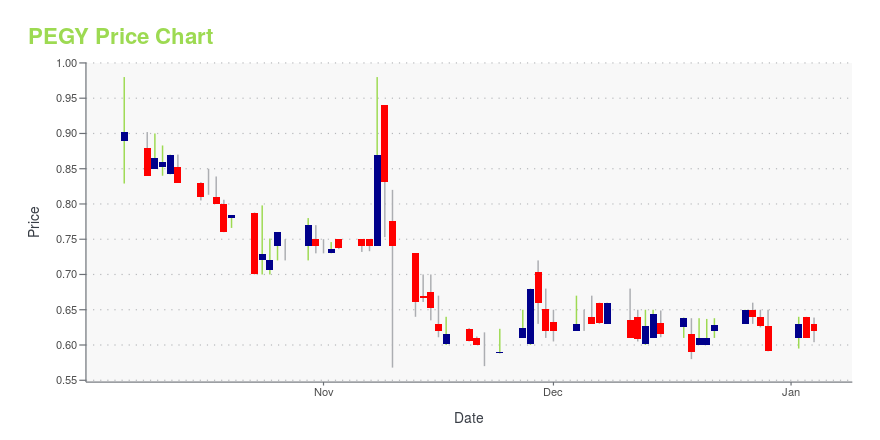
PEGY Stock Price Chart Interactive Chart >
Pineapple Holdings, Inc. (PEGY) Company Bio
Pineapple Holdings, Inc. provides photovoltaic solar energy systems to residential homeowners in the United States. It offers a range of installation services, including design, engineering, procurement, permitting, construction, grid connection, warranty, monitoring, and maintenance of residential solar energy systems. The company also offers battery storage products and energy management control devices on solar systems that are paired with batteries. In addition, it develops and manufactures energy management software and hardware. Pineapple Holdings, Inc. is based in Minnetonka, Minnesota.
Latest PEGY News From Around the Web
Below are the latest news stories about PINEAPPLE ENERGY INC that investors may wish to consider to help them evaluate PEGY as an investment opportunity.
Pineapple Energy Participates in Bank of America’s 2023 Renewables Conference and Janney’s Clean Energy Investment SymposiumMINNETONKA, Minn., Dec. 05, 2023 (GLOBE NEWSWIRE) -- Pineapple Energy Inc. (NASDAQ: PEGY), a leading provider of sustainable solar energy and back-up power to households and small businesses, is excited to announce that CEO Kyle Udseth and CFO Eric Ingvaldson attended Bank of America’s 2023 Renewables Conference in New York City, NY at the Bank of America Tower last week and will be attending Janney’s Clean Energy Investment Symposium this week in New Orleans, LA at Tulane University. The Clean |
Four Solar Sector Stocks Set To Soar in 2024The solar industry has been on a remarkable upward trajectory in the last decade, witnessing an annual growth rate of 24%. Factors like federal policies, cost reductions, and a growing demand for c... |
Pineapple Energy Inc. (NASDAQ:PEGY) Q3 2023 Earnings Call TranscriptPineapple Energy Inc. (NASDAQ:PEGY) Q3 2023 Earnings Call Transcript November 10, 2023 Operator: Good morning. And welcome to the Pineapple Energy Third Quarter 2023 Conference Call. As a reminder, today’s call is being recorded. All participants are in a listen-only mode. For opening remarks and introductions, I would like to turn the call over to […] |
Q3 2023 Pineapple Energy Inc Earnings CallQ3 2023 Pineapple Energy Inc Earnings Call |
Pineapple Energy Reports Third Quarter 2023 Financial ResultsRevenue up 211% from Q3 2022Gross profit up 401% from Q3 2022Operating Expenses up 125% from Q3 2022Net Loss from continuing operations decreased 8% from Q3 2022Pro forma adjusted EBITDA up 156% from Q3 2022Positive cash flow from operations of $869,851 MINNETONKA, Minn., Nov. 09, 2023 (GLOBE NEWSWIRE) -- Pineapple Energy Inc. (NASDAQ: PEGY), a leading provider of sustainable solar energy and back-up power to households and small businesses, today announced financial results for the third quarte |
PEGY Price Returns
| 1-mo | 17.09% |
| 3-mo | 45.90% |
| 6-mo | -82.09% |
| 1-year | -92.51% |
| 3-year | -99.67% |
| 5-year | -99.31% |
| YTD | -84.57% |
| 2023 | -74.59% |
| 2022 | -75.73% |
| 2021 | -47.48% |
| 2020 | -25.36% |
| 2019 | 210.18% |
Loading social stream, please wait...