Perion Network Ltd. (PERI): Price and Financial Metrics
GET POWR RATINGS... FREE!
PERI POWR Grades
- Sentiment is the dimension where PERI ranks best; there it ranks ahead of 91.4% of US stocks.
- PERI's strongest trending metric is Quality; it's been moving up over the last 177 days.
- PERI ranks lowest in Stability; there it ranks in the 19th percentile.
PERI Stock Summary
- For PERI, its debt to operating expenses ratio is greater than that reported by merely 13.84% of US equities we're observing.
- With a year-over-year growth in debt of -31%, PERION NETWORK LTD's debt growth rate surpasses merely 10.16% of about US stocks.
- In terms of twelve month growth in earnings before interest and taxes, PERION NETWORK LTD is reporting a growth rate of 153.07%; that's higher than 90.23% of US stocks.
- Stocks that are quantitatively similar to PERI, based on their financial statements, market capitalization, and price volatility, are CPRX, NTCT, DIOD, HRMY, and PRGS.
- Visit PERI's SEC page to see the company's official filings. To visit the company's web site, go to www.perion.com.
PERI Valuation Summary
- In comparison to the median Technology stock, PERI's EV/EBIT ratio is 23.62% lower, now standing at 15.2.
- Over the past 207 months, PERI's EV/EBIT ratio has gone down 11.3.
Below are key valuation metrics over time for PERI.
Stock | Date | P/S | P/B | P/E | EV/EBIT |
---|---|---|---|---|---|
PERI | 2023-01-31 | 2.6 | 2.8 | 19.3 | 15.2 |
PERI | 2023-01-30 | 2.6 | 2.8 | 19.3 | 15.2 |
PERI | 2023-01-27 | 2.5 | 2.8 | 19.2 | 15.1 |
PERI | 2023-01-26 | 2.5 | 2.7 | 18.6 | 14.6 |
PERI | 2023-01-25 | 2.5 | 2.7 | 18.8 | 14.7 |
PERI | 2023-01-24 | 2.5 | 2.7 | 18.6 | 14.6 |
PERI Growth Metrics
- Its year over year price growth rate is now at 34.07%.
- Its 2 year revenue growth rate is now at 87.83%.
- Its 2 year price growth rate is now at 394.05%.

The table below shows PERI's growth in key financial areas (numbers in millions of US dollars).
Date | Revenue | Operating Cash Flow | Net Income to Common Stock |
---|---|---|---|
2022-09-30 | 588.561 | 112.783 | 78.243 |
2022-06-30 | 550.975 | 92.286 | 63.283 |
2022-06-30 | 550.975 | 92.286 | 63.283 |
2022-03-31 | 513.996 | 81.19 | 50.866 |
2021-12-31 | 478.498 | 71.106 | 38.706 |
2021-12-31 | 478.498 | 71.106 | 38.706 |
PERI's Quality Factors
The “Quality” component of the POWR Ratings focuses on 31 different factors of a companies fundamentals and operational strength. Here are some key insights as we drill into the specifics of these quality attributes.- PERI has a Quality Grade of B, ranking ahead of 86.85% of graded US stocks.
- PERI's asset turnover comes in at 1.021 -- ranking 125th of 561 Business Services stocks.
- 500 - Internal server error
The table below shows PERI's key quality metrics over time.
Period | Asset Turnover | Gross Margin | ROIC |
---|---|---|---|
2020-12-31 | 1.021 | 0.931 | 0.210 |
2019-12-31 | 0.968 | 0.902 | 0.295 |
2018-12-31 | 0.953 | 0.906 | 0.218 |
2017-12-31 | 0.853 | 0.910 | -0.813 |
2016-12-31 | 0.772 | 0.947 | 0.070 |
2015-12-31 | 0.553 | 0.514 | -0.684 |
PERI Price Target
For more insight on analysts targets of PERI, see our PERI price target page. And for a list of of all stocks sorted by upside potential based on analyst target price, see our Top Price Target page.
Average Price Target | $30.00 | Average Broker Recommendation | 1.38 (Strong Buy) |
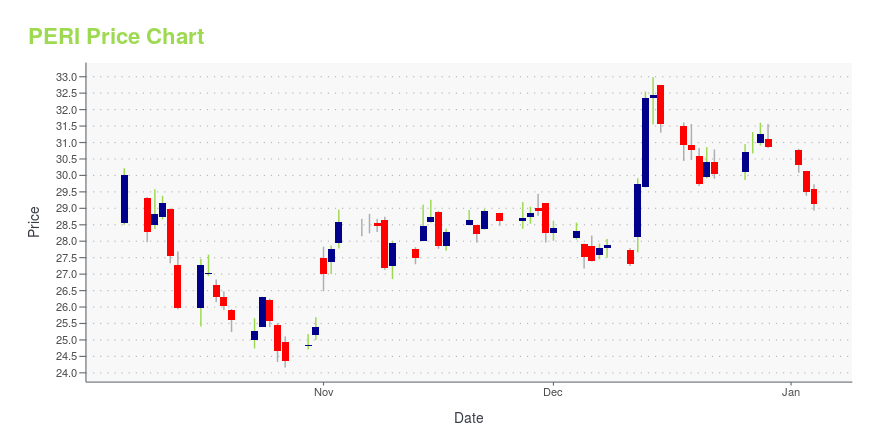
PERI Stock Price Chart Interactive Chart >
PERI Price/Volume Stats
Current price | $33.74 | 52-week high | $35.16 |
Prev. close | $33.93 | 52-week low | $16.41 |
Day low | $33.29 | Volume | 818,216 |
Day high | $33.98 | Avg. volume | 713,655 |
50-day MA | $28.19 | Dividend yield | N/A |
200-day MA | $22.62 | Market Cap | 1.50B |
Perion Network Ltd. (PERI) Company Bio
Perion Network Ltd., a performance-based media and Internet company, provides search-based monetization solutions in North America, Europe, and other countries. The company provides online publishers and app developers advanced technology, and various intelligent and data-driven solutions to monetize and promote their application or content. The company is based in Holon, Israel.
Latest PERI News From Around the Web
Below are the latest news stories about PERION NETWORK LTD that investors may wish to consider to help them evaluate PERI as an investment opportunity.
Analysts Estimate TechTarget (TTGT) to Report a Decline in Earnings: What to Look Out forTechTarget (TTGT) doesn't possess the right combination of the two key ingredients for a likely earnings beat in its upcoming report. Get prepared with the key expectations. |
Perion Network (PERI) Stock Sinks As Market Gains: What You Should KnowIn the latest trading session, Perion Network (PERI) closed at $33.47, marking a -0.09% move from the previous day. |
Microchip (MCHP) to Report Q3 Earnings: What's in the Cards?Microchip's (MCHP) fiscal third-quarter results are likely to reflect robust uptake of microcontrollers, despite supply chain constraints and weak consumer end-market. |
Cognizant (CTSH) to Report Q4 Earnings: What's in Store?Cognizant's (CTSH) fourth-quarter 2022 results are expected to reflect growing domain expertise in its digital business operations despite challenging macroeconomic conditions. |
Perion Network (PERI) Earnings Expected to Grow: What to Know Ahead of Next Week's ReleasePerion Network (PERI) possesses the right combination of the two key ingredients for a likely earnings beat in its upcoming report. Get prepared with the key expectations. |
PERI Price Returns
1-mo | 17.11% |
3-mo | 51.78% |
6-mo | 54.28% |
1-year | 60.06% |
3-year | 326.01% |
5-year | 1,024.67% |
YTD | 33.36% |
2022 | 5.20% |
2021 | 88.92% |
2020 | 104.66% |
2019 | 139.23% |
2018 | -15.86% |
Continue Researching PERI
Want to see what other sources are saying about Perion Network Ltd's financials and stock price? Try the links below:Perion Network Ltd (PERI) Stock Price | Nasdaq
Perion Network Ltd (PERI) Stock Quote, History and News - Yahoo Finance
Perion Network Ltd (PERI) Stock Price and Basic Information | MarketWatch
Loading social stream, please wait...