
Performant Financial Corporation (PFMT): Price and Financial Metrics
PFMT Price/Volume Stats
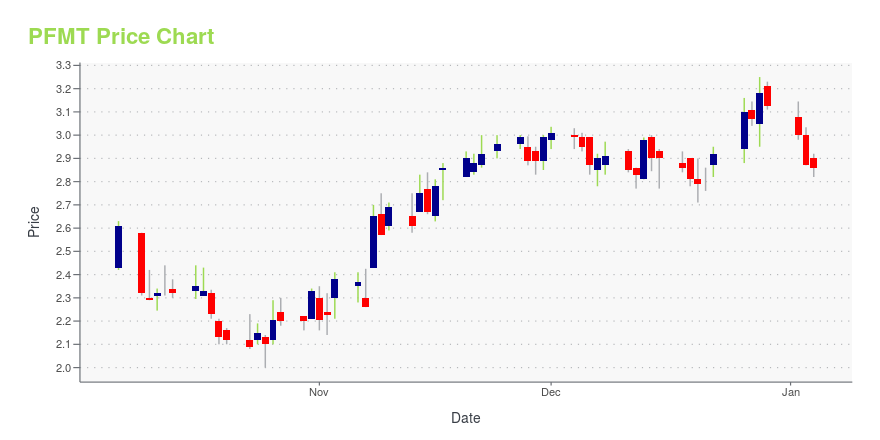
| Current price | $3.58 | 52-week high | $3.62 |
| Prev. close | $3.56 | 52-week low | $2.00 |
| Day low | $3.48 | Volume | 168,700 |
| Day high | $3.62 | Avg. volume | 193,925 |
| 50-day MA | $2.96 | Dividend yield | N/A |
| 200-day MA | $2.81 | Market Cap | 275.49M |
PFMT Stock Price Chart Interactive Chart >
Performant Financial Corporation (PFMT) Company Bio
Performant Financial Corporation provides technology-enabled recovery and related analytics services in the United States. Its services help identify and recover delinquent or defaulted assets and improper payments for government and private clients in various markets. The company was founded in 1976 and is based in Livermore, California.
Latest PFMT News From Around the Web
Below are the latest news stories about PERFORMANT FINANCIAL CORP that investors may wish to consider to help them evaluate PFMT as an investment opportunity.
The Market Should Be More Than Microsoft and Apple, and Someday It Will BeThe Nasdaq and S&P 500 followed up on their best weekly performances since the fourth quarter of 2022 with solid gains last week. The S&P 500 rose just over 1.3%. The advance was led by the Technology sector with a gain of better than 4.7% as Microsoft hit an all-time high. |
Performant Financial Corporation (NASDAQ:PFMT) Q3 2023 Earnings Call TranscriptPerformant Financial Corporation (NASDAQ:PFMT) Q3 2023 Earnings Call Transcript November 7, 2023 Performant Financial Corporation beats earnings expectations. Reported EPS is $-0.01, expectations were $-0.02. Operator: Good afternoon, ladies and gentlemen and welcome to the Performant Financial Corp. Third Quarter 2023 Earnings Conference Call. [Operator Instructions] This call is being recorded on Tuesday, August 8, […] |
Performant to Participate in the 14th Annual Craig-Hallum Alpha Select ConferencePLANTATION, Fla., November 08, 2023--Performant Financial Corporation (Nasdaq: PFMT) (the "Company"), primarily operating as Performant Healthcare Solutions, a leading provider of technology-enabled payment integrity, eligibility, and related analytics services, announced today that it will participate in the 14th Annual Craig-Hallum Alpha Select Conference that is being held in New York City on Thursday November 16th. |
Performant Financial Corporation Announces Financial Results for Third Quarter 2023PLANTATION, Fla., November 07, 2023--Performant Financial Corporation (Nasdaq: PFMT), (the "Company"), primarily operating as Performant Healthcare Solutions, a leading provider of technology-enabled audit, recovery, and related analytics services in the United States with a focus in the healthcare payment integrity industry, today reported the following financial results for its third quarter ended September 30, 2023: |
Owning 49% shares,institutional owners seem interested in Performant Financial Corporation (NASDAQ:PFMT),Key Insights Significantly high institutional ownership implies Performant Financial's stock price is sensitive to... |
PFMT Price Returns
| 1-mo | 28.32% |
| 3-mo | 31.62% |
| 6-mo | 26.50% |
| 1-year | 31.38% |
| 3-year | -15.76% |
| 5-year | 179.69% |
| YTD | 14.56% |
| 2023 | -13.43% |
| 2022 | 49.79% |
| 2021 | 173.55% |
| 2020 | -13.63% |
| 2019 | -54.67% |
Continue Researching PFMT
Want to see what other sources are saying about Performant Financial Corp's financials and stock price? Try the links below:Performant Financial Corp (PFMT) Stock Price | Nasdaq
Performant Financial Corp (PFMT) Stock Quote, History and News - Yahoo Finance
Performant Financial Corp (PFMT) Stock Price and Basic Information | MarketWatch
Loading social stream, please wait...