
Polar Power, Inc. (POLA): Price and Financial Metrics
POLA Price/Volume Stats
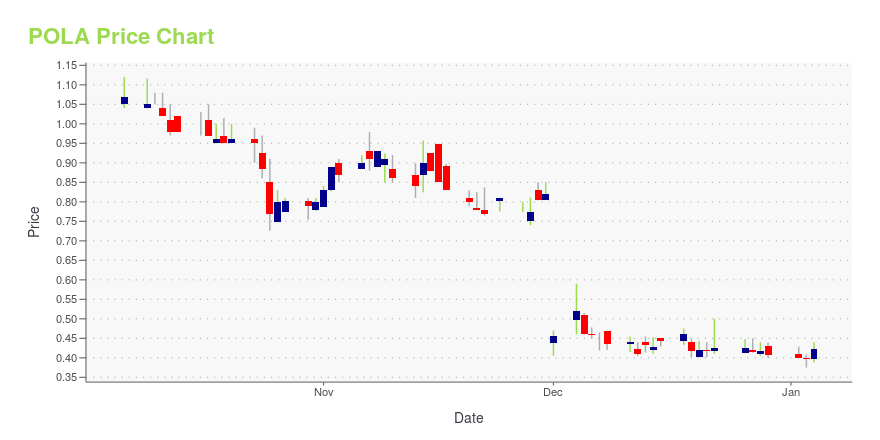
| Current price | $0.43 | 52-week high | $1.58 |
| Prev. close | $0.43 | 52-week low | $0.32 |
| Day low | $0.42 | Volume | 8,313 |
| Day high | $0.45 | Avg. volume | 95,212 |
| 50-day MA | $0.45 | Dividend yield | N/A |
| 200-day MA | $0.51 | Market Cap | 5.62M |
POLA Stock Price Chart Interactive Chart >
Polar Power, Inc. (POLA) Company Bio
Polar Power, Inc. designs, manufactures, and sells direct current (DC) power systems for applications in the telecommunications, military, electric vehicle charging, cogeneration, distributed power, and uninterruptable power supply markets. It offers DC base power systems, DC hybrid power systems, and DC solar hybrid power systems. Polar Power, Inc. installs, sells, and services its products through its direct sales force and a network of independent service providers and dealers. The company was formerly known as Polar Products, Inc. Polar Power, Inc. was founded in 1979 and is based in Gardena, California.
Latest POLA News From Around the Web
Below are the latest news stories about POLAR POWER INC that investors may wish to consider to help them evaluate POLA as an investment opportunity.
United Nations High Commissioner for Refugees Awards Polar Power Initial Contract to Assure Uninterrupted Quality Electric Power for African OfficesPilot program designed to showcase the provision of reliable, easily maintained, and cost-effective electric power in bad or no grid locations GARDENA, CA, Dec. 20, 2023 (GLOBE NEWSWIRE) -- Polar Power, Inc. (“Polar Power” or the “Company”) (NASDAQ: POLA), a global provider of prime, backup, and solar hybrid power solutions, announces a contract award from the United Nations High Commissioner for Refugees (“UNHCR”) to provide a nano grid for one of its offices in Africa. The pilot project is des |
This Is Why Polar Power, Inc.'s (NASDAQ:POLA) CEO Compensation Looks AppropriateKey Insights Polar Power will host its Annual General Meeting on 20th of December Salary of US$275.0k is part of CEO... |
Polar Power, Inc. Announces Closing of Public OfferingGardena, CA, Dec. 05, 2023 (GLOBE NEWSWIRE) -- Polar Power, Inc. (Nasdaq: POLA) (“Polar Power” or the “Company”), a technology company that designs, manufactures and sells direct current, or DC, power systems, lithium battery powered hybrid solar systems for applications in the telecommunications market and, in other markets, including military, EV charging, cogeneration, distributed power and uninterruptable power supply, today announced the closing of its previously announced public offering o |
Why Is Polar Power (POLA) Stock Down 51% Today?Polar Power stock is falling on Friday as investors in POLA shares react to the pricing of a public offering for the company's units. |
Why Is Smart for Life (SMFL) Stock Down 37% Today?Smart for Life stock is falling on Friday after the company reached an agreement with holders of warrants for SMFL shares. |
POLA Price Returns
| 1-mo | 6.33% |
| 3-mo | 21.81% |
| 6-mo | 13.16% |
| 1-year | -64.17% |
| 3-year | -93.74% |
| 5-year | -90.40% |
| YTD | 5.57% |
| 2023 | -68.43% |
| 2022 | -63.97% |
| 2021 | -25.03% |
| 2020 | 100.63% |
| 2019 | -50.72% |
Loading social stream, please wait...