PROG Holdings, Inc. (PRG): Price and Financial Metrics
PRG Price/Volume Stats
Current price | $33.21 | 52-week high | $44.81 |
Prev. close | $32.43 | 52-week low | $12.11 |
Day low | $32.65 | Volume | 523,600 |
Day high | $33.74 | Avg. volume | 448,425 |
50-day MA | $35.26 | Dividend yield | N/A |
200-day MA | $28.43 | Market Cap | 1.55B |
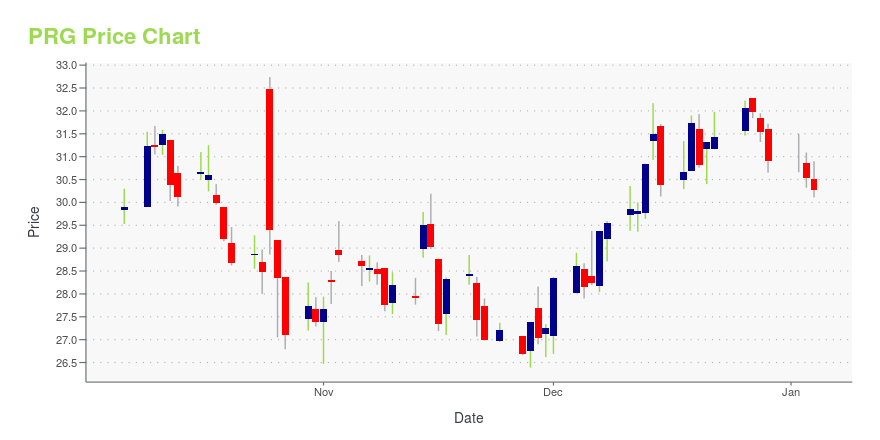
PRG Stock Price Chart Interactive Chart >
PRG POWR Grades
- PRG scores best on the Quality dimension, with a Quality rank ahead of 91.89% of US stocks.
- The strongest trend for PRG is in Growth, which has been heading up over the past 177 days.
- PRG ranks lowest in Momentum; there it ranks in the 17th percentile.
PRG Stock Summary
- PROG HOLDINGS INC's capital turnover -- a measure of revenue relative to shareholder's equity -- is better than 87.97% of US listed stocks.
- With a one year PEG ratio of 173.75, PROG HOLDINGS INC is expected to have a higher PEG ratio (a measure of how expensive a stock is relative to its expected earnings growth) than 84.51% of US stocks.
- PRG's went public 37.76 years ago, making it older than 93.16% of listed US stocks we're tracking.
- Stocks that are quantitatively similar to PRG, based on their financial statements, market capitalization, and price volatility, are ACEL, EZFL, HTBK, SSB, and SFT.
- PRG's SEC filings can be seen here. And to visit PROG HOLDINGS INC's official web site, go to www.aarons.com.
PRG Valuation Summary
- In comparison to the median Industrials stock, PRG's EV/EBIT ratio is 50.32% lower, now standing at 7.8.
- Over the past 243 months, PRG's price/sales ratio has gone down 0.4.
Below are key valuation metrics over time for PRG.
Stock | Date | P/S | P/B | P/E | EV/EBIT |
---|---|---|---|---|---|
PRG | 2023-09-19 | 0.6 | 2.5 | 10.8 | 7.8 |
PRG | 2023-09-18 | 0.6 | 2.5 | 10.8 | 7.8 |
PRG | 2023-09-15 | 0.6 | 2.6 | 11.2 | 8.1 |
PRG | 2023-09-14 | 0.6 | 2.7 | 11.6 | 8.3 |
PRG | 2023-09-13 | 0.6 | 2.6 | 11.4 | 8.2 |
PRG | 2023-09-12 | 0.6 | 2.6 | 11.2 | 8.1 |
PRG Growth Metrics
- Its 4 year price growth rate is now at -10.61%.
- Its year over year price growth rate is now at -49.54%.
- Its 4 year net cashflow from operations growth rate is now at 1.37%.

The table below shows PRG's growth in key financial areas (numbers in millions of US dollars).
Date | Revenue | Operating Cash Flow | Net Income to Common Stock |
---|---|---|---|
2022-12-31 | 2,597.826 | 242.479 | 98.709 |
2022-09-30 | 2,632.272 | 234.221 | 100.443 |
2022-06-30 | 2,656.856 | 162.862 | 141.851 |
2022-03-31 | 2,667.383 | 177.192 | 191.204 |
2021-12-31 | 2,677.92 | 245.961 | 243.557 |
2021-09-30 | 2,637.029 | 199.008 | 246.556 |
PRG's Quality Factors
The “Quality” component of the POWR Ratings focuses on 31 different factors of a companies fundamentals and operational strength. Here are some key insights as we drill into the specifics of these quality attributes.- PRG has a Quality Grade of B, ranking ahead of 91.91% of graded US stocks.
- PRG's asset turnover comes in at 1.885 -- ranking 41st of 563 Business Services stocks.
- MCHX, MIGI, and ID are the stocks whose asset turnover ratios are most correlated with PRG.
The table below shows PRG's key quality metrics over time.
Period | Asset Turnover | Gross Margin | ROIC |
---|---|---|---|
2021-09-30 | 1.885 | 1.000 | 0.373 |
2021-06-30 | 1.730 | 0.988 | 0.308 |
2021-03-31 | 1.640 | 0.978 | 0.236 |
2020-12-31 | 0.987 | 1.000 | -0.010 |
2020-09-30 | 1.390 | 0.967 | -0.091 |
2020-06-30 | 1.324 | 0.967 | -0.118 |
PRG Price Target
For more insight on analysts targets of PRG, see our PRG price target page. And for a list of of all stocks sorted by upside potential based on analyst target price, see our Top Price Target page.
Average Price Target | $68.25 | Average Broker Recommendation | 1.38 (Strong Buy) |
PROG Holdings, Inc. (PRG) Company Bio
PROG Holdings, Inc. operates as a holding company. The Company, through its subsidiaries, provides commercial equipment finance and leasing services. PROG Holdings serves customers in the United States.
Latest PRG News From Around the Web
Below are the latest news stories about PROG HOLDINGS INC that investors may wish to consider to help them evaluate PRG as an investment opportunity.
5 Blue-Chip Stocks AI Thinks Will Double Your Money by 2027Blue-chip stocks are traditionally market laggards, but the MarketMaster AI is flashing major "buy" signals in these 5 names right now. |
Why Fast-paced Mover PROG Holdings (PRG) Is a Great Choice for Value InvestorsIf you are looking for stocks that have gained strong momentum recently but are still trading at reasonable prices, PROG Holdings (PRG) could be a great choice. It is one of the several stocks that passed through our 'Fast-Paced Momentum at a Bargain' screen. |
Here's Why PROG Holdings (PRG) Is a Great 'Buy the Bottom' Stock NowAfter losing some value lately, a hammer chart pattern has been formed for PROG Holdings (PRG), indicating that the stock has found support. This, combined with an upward trend in earnings estimate revisions, could lead to a trend reversal for the stock in the near term. |
Wall Street Analysts Predict a 27.65% Upside in PROG Holdings (PRG): Here's What You Should KnowThe mean of analysts' price targets for PROG Holdings (PRG) points to a 27.7% upside in the stock. While this highly sought-after metric has not proven reasonably effective, strong agreement among analysts in raising earnings estimates does indicate an upside in the stock. |
PROG Holdings Exceeds Second Quarter 2023 Expectations, Raises Full-Year Financial OutlookSALT LAKE CITY, July 26, 2023--PROG Holdings, Inc. (NYSE:PRG), the fintech holding company for Progressive Leasing, Vive Financial, Four Technologies, and Build today announced financial results for the second quarter ended June 30, 2023. |
PRG Price Returns
1-mo | -3.18% |
3-mo | 3.39% |
6-mo | 35.94% |
1-year | 121.70% |
3-year | -30.78% |
5-year | N/A |
YTD | 96.63% |
2022 | -62.56% |
2021 | -16.26% |
2020 | 11.80% |
2019 | N/A |
2018 | N/A |
Loading social stream, please wait...