Power REIT (MD) (PW): Price and Financial Metrics

Power REIT (MD) (PW): $0.80

0.02 (+2.54%)

POWR Rating

Component Grades

Momentum

C

Stability

C

Sentiment

Quality

C

Add PW to Watchlist
Sign Up

Industry: REITs - Industrial

Industry

NR

Ranked

#3 of 19

in industry

PW Price/Volume Stats

Current price $0.80 52-week high $3.90
Prev. close $0.78 52-week low $0.50
Day low $0.77 Volume 1,496
Day high $0.82 Avg. volume 16,408
50-day MA $0.62 Dividend yield N/A
200-day MA $0.95 Market Cap 2.70M

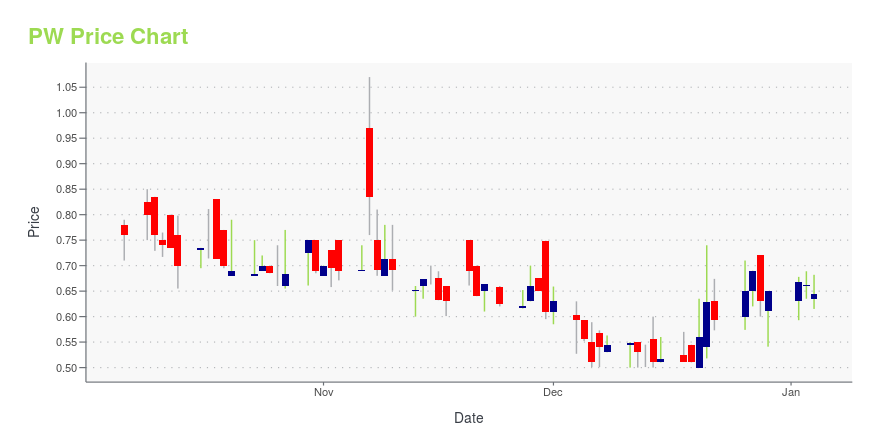
PW Stock Price Chart Interactive Chart >

PW Stock Summary

  • PW has a market capitalization of $2,243,956 -- more than approximately just 1.02% of US stocks.
  • PW's one year PEG ratio, measuring expected growth in earnings next year relative to current common stock price is 0.01 -- higher than only 0.35% of US-listed equities with positive expected earnings growth.
  • In terms of twelve month growth in earnings before interest and taxes, POWER REIT is reporting a growth rate of -662.52%; that's higher than merely 1.99% of US stocks.
  • Stocks that are quantitatively similar to PW, based on their financial statements, market capitalization, and price volatility, are BBGI, ADV, CPE, SSL, and GGE.
  • Visit PW's SEC page to see the company's official filings. To visit the company's web site, go to www.pwreit.com.

PW Valuation Summary

  • In comparison to the median Real Estate stock, PW's price/sales ratio is 58.33% lower, now standing at 0.5.
  • Over the past 243 months, PW's EV/EBIT ratio has gone up 2.6.

Below are key valuation metrics over time for PW.

Stock Date P/S P/B P/E EV/EBIT
PW 2023-12-29 0.5 0.1 -0.1 -1.3
PW 2023-12-28 0.5 0.1 -0.1 -1.3
PW 2023-12-27 0.6 0.1 -0.1 -1.4
PW 2023-12-26 0.5 0.1 -0.1 -1.3
PW 2023-12-22 0.5 0.1 -0.1 -1.3
PW 2023-12-21 0.5 0.1 -0.1 -1.3

PW Growth Metrics

    The 4 year net income to common stockholders growth rate now stands at 12793.6%.
  • The 5 year net income to common stockholders growth rate now stands at 12793.6%.
  • Its 2 year price growth rate is now at 56.28%.
PW's revenue has moved up $6,059,705 over the prior 49 months.

The table below shows PW's growth in key financial areas (numbers in millions of US dollars).

Date Revenue Operating Cash Flow Net Income to Common Stock
2022-09-30 8.047905 8.471697 2.5436
2022-06-30 8.587608 10.0541 3.78664
2022-03-31 8.622503 9.893653 4.381411
2021-12-31 8.457914 8.000559 4.491656
2021-09-30 8.030736 7.031728 4.778127
2021-06-30 6.598974 4.887949 3.621331

PW's Quality Factors

The “Quality” component of the POWR Ratings focuses on 31 different factors of a companies fundamentals and operational strength. Here are some key insights as we drill into the specifics of these quality attributes.
  • PW has a Quality Grade of C, ranking ahead of 69.4% of graded US stocks.
  • PW's asset turnover comes in at 0.106 -- ranking 200th of 444 Trading stocks.
  • BX, CG, and GS are the stocks whose asset turnover ratios are most correlated with PW.

The table below shows PW's key quality metrics over time.

Period Asset Turnover Gross Margin ROIC
2021-06-30 0.106 1 0.083
2021-03-31 0.105 1 0.075
2020-12-31 0.109 1 0.066
2020-09-30 0.091 1 0.055
2020-06-30 0.086 1 0.052
2020-06-30 0.086 1 0.052

Power REIT (MD) (PW) Company Bio


Power REIT is a real estate investment trust (REIT) that owns real estate related to infrastructure assets including properties for Controlled Environment Agriculture, Renewable Energy and Transportation. Power REIT is actively seeking to expand its real estate portfolio related to Controlled Environment Agriculture.


PW Latest News Stream


Event/Time News Detail
Loading, please wait...

PW Latest Social Stream


Loading social stream, please wait...

View Full PW Social Stream

Latest PW News From Around the Web

Below are the latest news stories about POWER REIT that investors may wish to consider to help them evaluate PW as an investment opportunity.

7 F-Rated REITs to Sell to Avoid Dividend Disappointments

While there are some fine REITs on the market, each of these have a fatal flaw that help lower their grades to an “F” rating.

Louis Navellier and the InvestorPlace Research Staff on InvestorPlace | September 14, 2023

Today’s Biggest Pre-Market Stock Movers: 10 Top Gainers and Losers on Wednesday

It's time for another dive into the biggest pre-market stock movers as we break down all of the biggest news on Wednesday!

William White on InvestorPlace | August 23, 2023

15 Worst Performing REITs in 2023

In this piece, we will take a look at the 15 worst performing REITs in 2023. If you want to skip our introduction to the current state of the different segments of the REIT industry, then head on over to 5 Worst Performing REITs in 2023. Like the banking industry, the property sector in America […]

Yahoo | August 8, 2023

Power REIT Announces 2022 Dividend Income Tax Treatment

Old Bethpage, NY, Jan. 30, 2023 (GLOBE NEWSWIRE) -- Power REIT ("Power REIT," "we," "our," or the "Company;" NYSE American: PW and PW.PRA), today announced the estimated Federal income tax treatment of the Company's 2022 distributions on its 7.75% Series A Preferred Stock (CUSIP # 73933H200). The Federal income tax classification of the distribution per share on the Company's 7.75% Series A Preferred Stock with respect to the calendar year ended December 31, 2022 is shown in the table below: Rec

Yahoo | January 30, 2023

Read More 'PW' Stories Here

PW Price Returns

1-mo 21.45%
3-mo 23.13%
6-mo -31.03%
1-year -76.47%
3-year -98.21%
5-year -86.69%
YTD 23.13%
2023 -83.55%
2022 -94.27%
2021 157.92%
2020 196.78%
2019 60.71%

Get Free Updates

Join thousands of investors who get the latest news, insights and top rated picks from StockNews.com!