
Quad Graphics, Inc (QUAD): Price and Financial Metrics
QUAD Price/Volume Stats
| Current price | $5.86 | 52-week high | $6.75 |
| Prev. close | $5.90 | 52-week low | $3.96 |
| Day low | $5.80 | Volume | 170,033 |
| Day high | $6.09 | Avg. volume | 147,425 |
| 50-day MA | $5.35 | Dividend yield | 3.32% |
| 200-day MA | $5.14 | Market Cap | 304.36M |
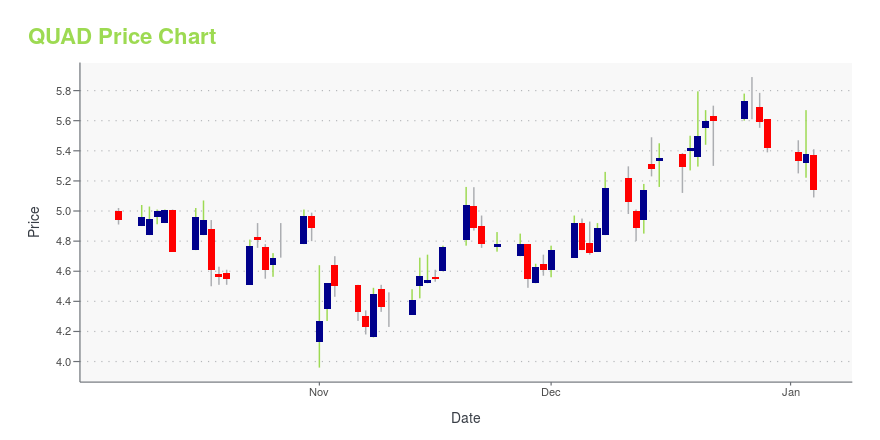
QUAD Stock Price Chart Interactive Chart >
Quad Graphics, Inc (QUAD) Company Bio
Quad/Graphics Inc. provides print and media solutions in the United States, Europe, and Latin America. The company was founded in 1971 and is based in Sussex, Wisconsin.
Latest QUAD News From Around the Web
Below are the latest news stories about QUAD/GRAPHICS INC that investors may wish to consider to help them evaluate QUAD as an investment opportunity.
Sidoti Events, LLC's Virtual December Small-Cap ConferenceNEW YORK, NY / ACCESSWIRE / December 5, 2023 / Sidoti Events, LLC, an affiliate of Sidoti & Company, LLC, has released the presentation schedule and weblinks for its two-day December Small-Cap Conference taking place Wednesday and Thursday, December ... |
Quad to Present at Sidoti Virtual Investor Conference December 6-7SUSSEX, Wis., November 30, 2023--Quad will present and host one-on-one meetings at the Sidoti Virtual Investor Conference on December 6-7, 2023. |
Quad/Graphics (NYSE:QUAD) shareholders have endured a 66% loss from investing in the stock five years agoStatistically speaking, long term investing is a profitable endeavour. But that doesn't mean long term investors can... |
Quad Releases 2023 ESG UpdateSUSSEX, Wis., November 14, 2023--Quad, a global marketing experience company, shares its progress on ESG initiatives. |
Quad/Graphics, Inc. (NYSE:QUAD) Q3 2023 Earnings Call TranscriptQuad/Graphics, Inc. (NYSE:QUAD) Q3 2023 Earnings Call Transcript November 1, 2023 Operator: Good morning, and welcome to the Quad’s third quarter conference call. [Operator Instructions] A slide presentation accompanies today’s webcast and participants are invited to follow along, advancing the slides themselves. To access the webcast, follow instructions posted in the earnings release. Alternatively, you […] |
QUAD Price Returns
| 1-mo | 14.45% |
| 3-mo | 30.98% |
| 6-mo | 4.48% |
| 1-year | 3.04% |
| 3-year | 67.87% |
| 5-year | -20.29% |
| YTD | 10.26% |
| 2023 | 32.84% |
| 2022 | 2.00% |
| 2021 | 4.71% |
| 2020 | -15.49% |
| 2019 | -57.47% |
QUAD Dividends
| Ex-Dividend Date | Type | Payout Amount | Change | ||||||
|---|---|---|---|---|---|---|---|---|---|
| Loading, please wait... | |||||||||
Continue Researching QUAD
Want to see what other sources are saying about Quad/Graphics Inc's financials and stock price? Try the links below:Quad/Graphics Inc (QUAD) Stock Price | Nasdaq
Quad/Graphics Inc (QUAD) Stock Quote, History and News - Yahoo Finance
Quad/Graphics Inc (QUAD) Stock Price and Basic Information | MarketWatch
Loading social stream, please wait...