
Rand Capital Corporation ($0.10 Par Value) (RAND): Price and Financial Metrics
RAND Price/Volume Stats
| Current price | $15.21 | 52-week high | $31.89 |
| Prev. close | $15.20 | 52-week low | $13.82 |
| Day low | $15.00 | Volume | 8,600 |
| Day high | $16.10 | Avg. volume | 10,529 |
| 50-day MA | $16.75 | Dividend yield | 7.63% |
| 200-day MA | $0.00 | Market Cap | 45.17M |
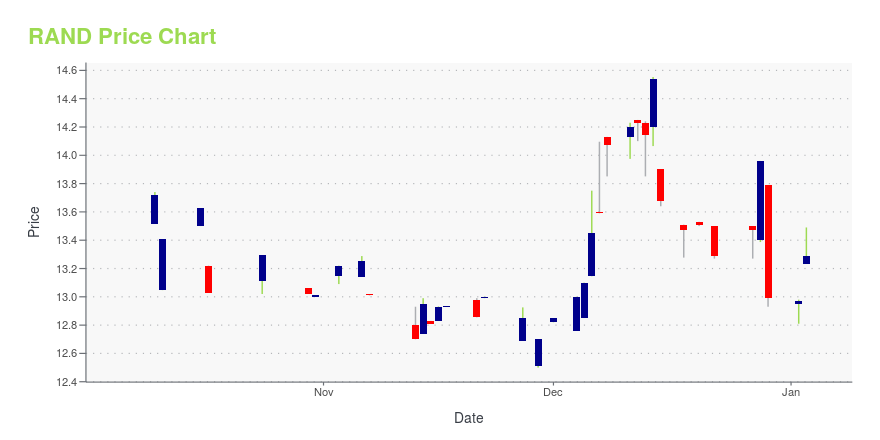
RAND Stock Price Chart Interactive Chart >
RAND Price Returns
| 1-mo | -18.23% |
| 3-mo | -5.31% |
| 6-mo | -43.86% |
| 1-year | 5.65% |
| 3-year | N/A |
| 5-year | 132.25% |
| YTD | -18.61% |
| 2024 | 91.44% |
| 2023 | 7.45% |
| 2022 | -17.05% |
| 2021 | -0.95% |
| 2020 | -22.26% |
RAND Dividends
| Ex-Dividend Date | Type | Payout Amount | Change | ||||||
|---|---|---|---|---|---|---|---|---|---|
| Loading, please wait... | |||||||||
Continue Researching RAND
Want to do more research on Rand Capital Corp's stock and its price? Try the links below:Rand Capital Corp (RAND) Stock Price | Nasdaq
Rand Capital Corp (RAND) Stock Quote, History and News - Yahoo Finance
Rand Capital Corp (RAND) Stock Price and Basic Information | MarketWatch
Loading social stream, please wait...