
R1 RCM Inc. (RCM): Price and Financial Metrics
RCM Price/Volume Stats
| Current price | $13.01 | 52-week high | $18.53 |
| Prev. close | $12.92 | 52-week low | $8.87 |
| Day low | $12.87 | Volume | 1,707,018 |
| Day high | $13.09 | Avg. volume | 3,110,600 |
| 50-day MA | $12.57 | Dividend yield | N/A |
| 200-day MA | $11.81 | Market Cap | 5.48B |
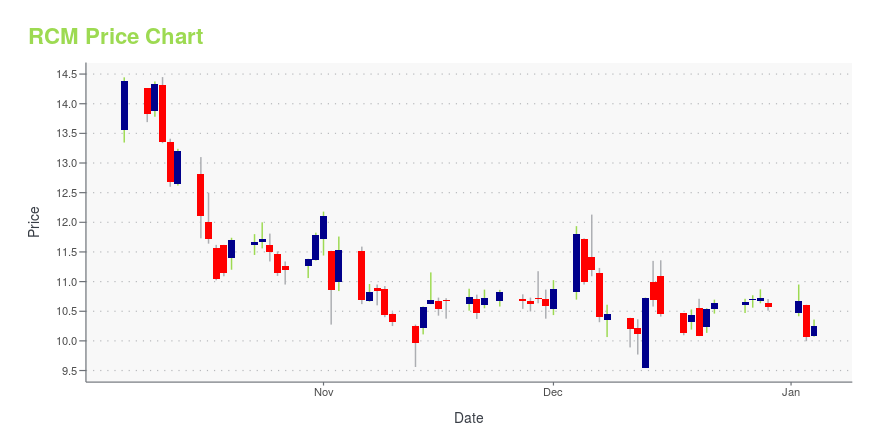
RCM Stock Price Chart Interactive Chart >
R1 RCM Inc. (RCM) Company Bio
R1 RCM Inc. provides revenue cycle management and physician advisory services for healthcare providers in the United States. It offers revenue cycle management services to manage their revenue cycles, which encompass patient registration, insurance and benefit verification, medical treatment documentation and coding, and bill preparation and collection from patients and payers. The company also provides physician advisory services, which offer concurrent level of care billing classification reviews, as well as retrospective chart audits to assist hospitals in properly billing payers for selected services. The company was formerly known as Accretive Health, Inc. and changed its name to R1 RCM Inc. in January 2017. R1 RCM Inc. was founded in 2003 and is based in Chicago, Illinois.
Latest RCM News From Around the Web
Below are the latest news stories about R1 RCM INC that investors may wish to consider to help them evaluate RCM as an investment opportunity.
13 Most Promising Future Stocks To Buy According To Hedge FundsIn this piece, we will take a look at the 13 most promising stocks to buy according to hedge funds. If you want to skip our overview of the latest stock market news, then you can take a look at the 5 Most Promising Future Stocks To Buy. Investing, for the most part, is all […] |
R1 RCM to Present at the 42nd Annual J.P. Morgan Healthcare ConferenceMURRAY, Utah, Dec. 21, 2023 (GLOBE NEWSWIRE) -- R1 RCM Inc. (NASDAQ: RCM), a leading provider of technology-driven solutions that transform the patient experience and financial performance of healthcare providers, today announced its management team will present at the 42nd Annual J.P. Morgan Healthcare Conference on Tuesday, January 9, 2023, at 10:30am ET. A live audio webcast of each presentation will be available on the Investor Relations section of R1’s website at r1rcm.com. A replay of the |
R1 RCM to Acquire AcclaraAcquisition of Providence’s Current Modular Services Business Accompanied by 10-Year Agreement to Provide Comprehensive Revenue Cycle Management Services R1 to Host Conference Call Today at 8:00 AM ET MURRAY, Utah, Dec. 06, 2023 (GLOBE NEWSWIRE) -- R1 RCM Inc. (NASDAQ: RCM) (“R1”), a leading provider of technology-driven solutions that transform the patient experience and financial performance of healthcare providers, today announced that it has entered into a definitive agreement to acquire Acc |
R1 Completes Restatement of Previously Issued Financial StatementsAs Expected, No Material Impact on 2023 Financial Results; No Impact on Cash, Business Operations or 2023 OutlookMURRAY, Utah, Dec. 04, 2023 (GLOBE NEWSWIRE) -- R1 RCM Inc. (NASDAQ: RCM) (“R1”) (“Company”), a leading provider of technology-driven solutions that transform the patient experience and financial performance of healthcare providers, today announced that it has completed the restatement of its previously issued financial statements for the years ended December 31, 2022 and 2021 and int |
R1 RCM Receives Notice of Filing Delinquency from NasdaqMURRAY, Utah, Nov. 17, 2023 (GLOBE NEWSWIRE) -- R1 RCM Inc. (NASDAQ: RCM), a leading provider of technology-driven solutions that transform the patient experience and financial performance of healthcare providers, today announced that, as anticipated, it received a letter from Nasdaq’s Listing Qualifications Department indicating that, as a result of the Company’s delay in filing its Quarterly Report on Form 10-Q for the three and nine months ended September 30, 2023 (the “Form 10-Q”), the Compa |
RCM Price Returns
| 1-mo | 3.34% |
| 3-mo | 9.33% |
| 6-mo | 25.70% |
| 1-year | -19.49% |
| 3-year | -37.18% |
| 5-year | 0.08% |
| YTD | 23.08% |
| 2023 | -3.47% |
| 2022 | -57.04% |
| 2021 | 6.12% |
| 2020 | 85.05% |
| 2019 | 63.27% |
Continue Researching RCM
Want to see what other sources are saying about R1 Rcm Inc's financials and stock price? Try the links below:R1 Rcm Inc (RCM) Stock Price | Nasdaq
R1 Rcm Inc (RCM) Stock Quote, History and News - Yahoo Finance
R1 Rcm Inc (RCM) Stock Price and Basic Information | MarketWatch
Loading social stream, please wait...