
Rent the Runway, Inc. (RENT): Price and Financial Metrics
RENT Price/Volume Stats
| Current price | $15.00 | 52-week high | $41.81 |
| Prev. close | $15.59 | 52-week low | $4.46 |
| Day low | $14.91 | Volume | 43,800 |
| Day high | $15.91 | Avg. volume | 673,994 |
| 50-day MA | $21.48 | Dividend yield | N/A |
| 200-day MA | $13.67 | Market Cap | 55.08M |
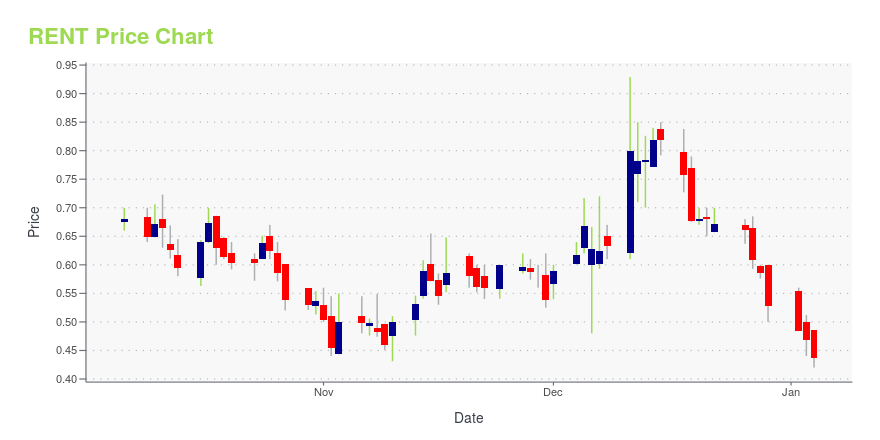
RENT Stock Price Chart Interactive Chart >
Rent the Runway, Inc. (RENT) Company Bio
Rent the Runway, Inc. rents designer dresses, clothing, and accessories for women through its stores and online platform. The company offers dresses, tops, sweaters, outerwear, pants, skirts, gowns, jumpsuits and rompers, activewear, and maternity clothes. It also offers handbags, jewelry, and other accessories. Rent the Runway, Inc. was founded in 2008 and is based in Brooklyn, New York. It has stores in New York, New York and Santa Monica, California.
Latest RENT News From Around the Web
Below are the latest news stories about RENT THE RUNWAY INC that investors may wish to consider to help them evaluate RENT as an investment opportunity.
Earnings Release: Here's Why Analysts Cut Their Rent the Runway, Inc. (NASDAQ:RENT) Price Target To US$1.94It's been a good week for Rent the Runway, Inc. ( NASDAQ:RENT ) shareholders, because the company has just released its... |
Rent the Runway, Inc. (NASDAQ:RENT) Q3 2023 Earnings Call TranscriptRent the Runway, Inc. (NASDAQ:RENT) Q3 2023 Earnings Call Transcript December 5, 2023 Rent the Runway, Inc. misses on earnings expectations. Reported EPS is $-0.45 EPS, expectations were $-0.42. Operator: Welcome to Rent the Runway’s Third Quarter 2023 Earnings Results Conference Call. At this time, all participants are in a listen-only mode. A question-and-answer session […] |
Rent the Runway is in 'investor purgatory,' CEO explainsRent the Runway (RENT) fell short of third-quarter earnings estimates while issuing a debt restructuring. Rent the Runway CEO Jennifer Hyman sits down with Yahoo Finance Live to discuss investor sentiment and the future of the high-end clothing subscription service. "There is zero belief in the business from an investor standpoint," Hyman says, elaborating on the company's debt restructuring: "What we've done... is we've basically removed $66 million in cash and PIK [paid-in-kind] interest over the next six quarters, we've frozen the debt with our lenders who have been very constructive, and we've reduced our minimum liquidity covenant." For more expert insight and the latest market action, click here to watch this full episode of Yahoo Finance Live. |
Rent the Runway, Inc. (NASDAQ:RENT) Looks Just Right With A 26% Price JumpRent the Runway, Inc. ( NASDAQ:RENT ) shareholders are no doubt pleased to see that the share price has bounced 26% in... |
Q3 2023 Rent the Runway Inc Earnings CallQ3 2023 Rent the Runway Inc Earnings Call |
RENT Price Returns
| 1-mo | -20.55% |
| 3-mo | 36.36% |
| 6-mo | 23.56% |
| 1-year | -58.56% |
| 3-year | N/A |
| 5-year | N/A |
| YTD | 42.18% |
| 2023 | -82.70% |
| 2022 | -62.58% |
| 2021 | N/A |
| 2020 | N/A |
| 2019 | N/A |
Loading social stream, please wait...