Revlon, Inc. New (REV): Price and Financial Metrics
GET POWR RATINGS... FREE!
REV POWR Grades
- Quality is the dimension where REV ranks best; there it ranks ahead of 85.57% of US stocks.
- REV's strongest trending metric is Momentum; it's been moving up over the last 179 days.
- REV ranks lowest in Momentum; there it ranks in the 18th percentile.
REV Stock Summary
- The capital turnover (annual revenue relative to shareholder's equity) for REV is -1.03 -- better than merely 4.11% of US stocks.
- REV's price/sales ratio is 0.22; that's higher than the P/S ratio of merely 3.12% of US stocks.
- Equity multiplier, or assets relative to shareholders' equity, comes in at -1.21 for Revlon Inc; that's greater than it is for only 4.7% of US stocks.
- Stocks with similar financial metrics, market capitalization, and price volatility to Revlon Inc are STON, VSTA, IHRT, SKYW, and UGI.
- REV's SEC filings can be seen here. And to visit Revlon Inc's official web site, go to www.revlon.com.
REV Valuation Summary
- REV's price/sales ratio is 0.3; this is 78.57% lower than that of the median Consumer Defensive stock.
- Over the past 243 months, REV's price/earnings ratio has gone up 1.
- REV's price/sales ratio has moved down 0 over the prior 243 months.
Below are key valuation metrics over time for REV.
Stock | Date | P/S | P/B | P/E | EV/EBIT |
---|---|---|---|---|---|
REV | 2021-09-03 | 0.3 | -0.3 | -1.4 | 105.7 |
REV | 2021-09-02 | 0.3 | -0.3 | -1.4 | 106.3 |
REV | 2021-09-01 | 0.3 | -0.3 | -1.4 | 105.8 |
REV | 2021-08-31 | 0.3 | -0.3 | -1.4 | 106.0 |
REV | 2021-08-30 | 0.3 | -0.3 | -1.4 | 106.3 |
REV | 2021-08-27 | 0.3 | -0.3 | -1.4 | 106.5 |
REV Growth Metrics
- Its 2 year net income to common stockholders growth rate is now at -25.58%.
- Its 3 year revenue growth rate is now at 33.5%.
- The 3 year net income to common stockholders growth rate now stands at -510.29%.

The table below shows REV's growth in key financial areas (numbers in millions of US dollars).
Date | Revenue | Operating Cash Flow | Net Income to Common Stock |
---|---|---|---|
2021-12-31 | 2,078.7 | -11 | -206.9 |
2021-09-30 | 2,090.1 | 72.9 | -450.6 |
2021-06-30 | 2,046.1 | 27.6 | -442 |
2021-03-31 | 1,896.3 | -48.1 | -501.1 |
2020-12-31 | 1,904.3 | -97.3 | -619 |
2020-09-30 | 1,977.1 | -158.4 | -359.4 |
REV's Quality Factors
The “Quality” component of the POWR Ratings focuses on 31 different factors of a companies fundamentals and operational strength. Here are some key insights as we drill into the specifics of these quality attributes.- REV has a Quality Grade of B, ranking ahead of 75.42% of graded US stocks.
- REV's asset turnover comes in at 0.791 -- ranking 34th of 50 Consumer Goods stocks.
- HOG, ECL, and IMAX are the stocks whose asset turnover ratios are most correlated with REV.
The table below shows REV's key quality metrics over time.
Period | Asset Turnover | Gross Margin | ROIC |
---|---|---|---|
2021-06-30 | 0.791 | 0.569 | 0.009 |
2021-03-31 | 0.694 | 0.550 | -0.010 |
2020-12-31 | 0.675 | 0.548 | -0.056 |
2020-09-30 | 0.674 | 0.544 | -0.045 |
2020-06-30 | 0.710 | 0.553 | -0.050 |
2020-03-31 | 0.781 | 0.564 | -0.036 |
REV Price Target
For more insight on analysts targets of REV, see our REV price target page. And for a list of of all stocks sorted by upside potential based on analyst target price, see our Top Price Target page.
Average Price Target | $11.00 | Average Broker Recommendation | 2 (Hold) |
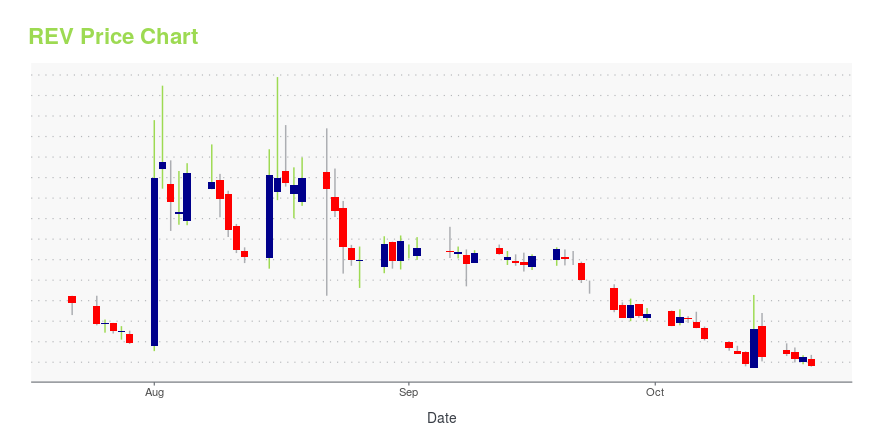
REV Stock Price Chart Interactive Chart >
REV Price/Volume Stats
Current price | $5.22 | 52-week high | $17.65 |
Prev. close | $5.42 | 52-week low | $1.08 |
Day low | $5.10 | Volume | 21,550,439 |
Day high | $6.38 | Avg. volume | 7,597,032 |
50-day MA | $4.88 | Dividend yield | N/A |
200-day MA | $8.99 | Market Cap | 283.21M |
Revlon, Inc. New (REV) Company Bio
Revlon manufactures, markets and sells a range of beauty and personal care products, including cosmetics, hair color, hair care and hair treatments, beauty tools, men's grooming products, anti-perspirant deodorants, fragrances, skincare and other beauty care products. The company was founded in 1932 and is based in New York, New York.
Latest REV News From Around the Web
Below are the latest news stories about Revlon Inc that investors may wish to consider to help them evaluate REV as an investment opportunity.
Revlon Reports Fourth Quarter and Full Year 2021 ResultsNEW YORK--(BUSINESS WIRE)--Revlon, Inc. (NYSE: REV) (“Revlon” and together with its subsidiaries, the “Company”) today announced its results for the quarter ended December 31, 2021. Quarter ended December 31, 2021, summary developments:1 As Reported net sales were $615.2 million in the fourth quarter of 2021, compared to $626.6 million during the prior-year period, a decrease of $11.4 million, or 1.8%. As Reported operating income was $67.3 million in the fourth quarter of 2021, compared to $28 |
Revlon Non-GAAP EPS of $0.34, revenue of $615.2MRevlon press release (REV): Q4 Non-GAAP EPS of $0.34.Revenue of $615.2M (-1.8% Y/Y).CEO comment: "We continued to take aggressive action to protect our business by tightly managing… |
Revlon (REV) Q4 Earnings Beat EstimatesRevlon (REV) delivered earnings and revenue surprises of 466.67% and 4.71%, respectively, for the quarter ended December 2021. Do the numbers hold clues to what lies ahead for the stock? |
Revlon to Release Fourth Quarter and Full Year 2021 Results and Host a Conference Call on March 3, 2022NEW YORK--(BUSINESS WIRE)--Revlon, Inc. (NYSE: REV) today announced that on Thursday, March 3, 2022, the Company intends to release its results for the fourth quarter and full year ended December 31, 2021, and host a conference call at 8:30 A.M. NYC time. Revlon’s earnings call can be accessed from the U.S. and Canada by dialing 1-866-342-8591, using the passcode “Revlon.” Callers from outside the U.S. and Canada may access the call by dialing 1-203-518-9713, using the passcode “Revlon.” Altern |
Inter Parfums (IPAR) Reports Q4 Loss, Lags Revenue EstimatesInter Parfums (IPAR) delivered earnings and revenue surprises of 75% and 0.04%, respectively, for the quarter ended December 2021. Do the numbers hold clues to what lies ahead for the stock? |
REV Price Returns
1-mo | 26.70% |
3-mo | -35.87% |
6-mo | -53.97% |
1-year | -59.15% |
3-year | -72.35% |
5-year | -77.97% |
YTD | -53.97% |
2021 | -4.55% |
2020 | -44.54% |
2019 | -14.97% |
2018 | 15.55% |
2017 | -25.21% |
Continue Researching REV
Want to see what other sources are saying about Revlon Inc's financials and stock price? Try the links below:Revlon Inc (REV) Stock Price | Nasdaq
Revlon Inc (REV) Stock Quote, History and News - Yahoo Finance
Revlon Inc (REV) Stock Price and Basic Information | MarketWatch
Loading social stream, please wait...