Ryman Hospitality Properties, Inc. (REIT) (RHP): Price and Financial Metrics
RHP Price/Volume Stats
Current price | $82.05 | 52-week high | $98.60 |
Prev. close | $83.67 | 52-week low | $75.19 |
Day low | $81.46 | Volume | 594,500 |
Day high | $83.70 | Avg. volume | 452,303 |
50-day MA | $86.38 | Dividend yield | 4.74% |
200-day MA | $89.28 | Market Cap | 4.90B |
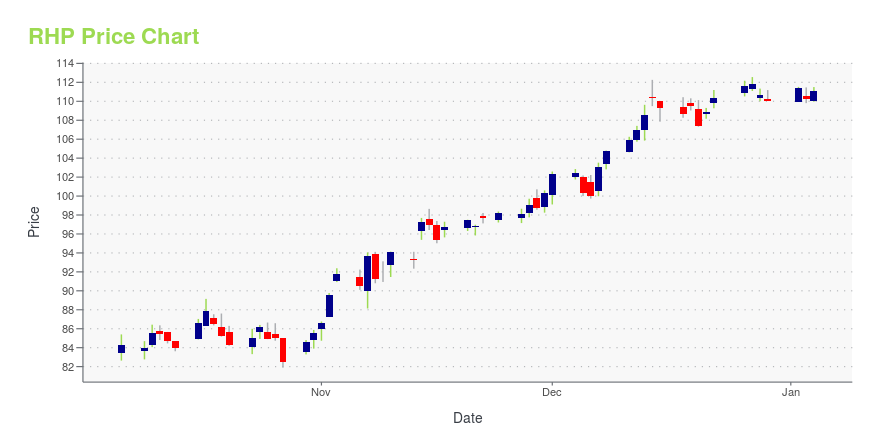
RHP Stock Price Chart Interactive Chart >
RHP POWR Grades
- Momentum is the dimension where RHP ranks best; there it ranks ahead of 57.65% of US stocks.
- The strongest trend for RHP is in Quality, which has been heading down over the past 177 days.
- RHP's current lowest rank is in the Quality metric (where it is better than 16.24% of US stocks).
RHP Stock Summary
- The capital turnover (annual revenue relative to shareholder's equity) for RHP is 11.94 -- better than 96.77% of US stocks.
- The ratio of debt to operating expenses for RYMAN HOSPITALITY PROPERTIES INC is higher than it is for about 95.46% of US stocks.
- Equity multiplier, or assets relative to shareholders' equity, comes in at -32.79 for RYMAN HOSPITALITY PROPERTIES INC; that's greater than it is for only 0.74% of US stocks.
- Stocks with similar financial metrics, market capitalization, and price volatility to RYMAN HOSPITALITY PROPERTIES INC are MAC, FRT, VNO, GTN, and GEL.
- Visit RHP's SEC page to see the company's official filings. To visit the company's web site, go to www.rymanhp.com.
RHP Valuation Summary
- RHP's price/sales ratio is 2.5; this is 127.27% higher than that of the median Real Estate stock.
- Over the past 243 months, RHP's price/earnings ratio has gone up 12.8.
Below are key valuation metrics over time for RHP.
Stock | Date | P/S | P/B | P/E | EV/EBIT |
---|---|---|---|---|---|
RHP | 2023-09-20 | 2.5 | 29.9 | 22.0 | 18.5 |
RHP | 2023-09-19 | 2.5 | 29.9 | 22.0 | 18.5 |
RHP | 2023-09-18 | 2.5 | 29.8 | 22.0 | 18.5 |
RHP | 2023-09-15 | 2.5 | 30.2 | 22.2 | 18.6 |
RHP | 2023-09-14 | 2.5 | 29.8 | 21.9 | 18.4 |
RHP | 2023-09-13 | 2.5 | 29.5 | 21.7 | 18.3 |
RHP Growth Metrics
- Its year over year cash and equivalents growth rate is now at 65.05%.
- The year over year net income to common stockholders growth rate now stands at 79.58%.
- The 5 year net income to common stockholders growth rate now stands at -57.82%.

The table below shows RHP's growth in key financial areas (numbers in millions of US dollars).
Date | Revenue | Operating Cash Flow | Net Income to Common Stock |
---|---|---|---|
2022-09-30 | 1,614.525 | 334.553 | 64.924 |
2022-06-30 | 1,453.676 | 266.76 | 11.137 |
2022-03-31 | 1,154.333 | 149.966 | -97.066 |
2021-12-31 | 939.373 | 111.253 | -176.966 |
2021-09-30 | 688.457 | -26.523 | -250.71 |
2021-06-30 | 451.8 | -78.617 | -359.823 |
RHP's Quality Factors
The “Quality” component of the POWR Ratings focuses on 31 different factors of a companies fundamentals and operational strength. Here are some key insights as we drill into the specifics of these quality attributes.- RHP has a Quality Grade of D, ranking ahead of 6.44% of graded US stocks.
- RHP's asset turnover comes in at 0.194 -- ranking 97th of 444 Trading stocks.
- CXW, PEB, and INN are the stocks whose asset turnover ratios are most correlated with RHP.
The table below shows RHP's key quality metrics over time.
Period | Asset Turnover | Gross Margin | ROIC |
---|---|---|---|
2021-09-30 | 0.194 | 0.148 | -0.020 |
2021-06-30 | 0.127 | -0.054 | -0.039 |
2021-03-31 | 0.083 | -0.395 | -0.058 |
2020-12-31 | 0.139 | -0.051 | -0.045 |
2020-09-30 | 0.216 | 0.134 | -0.023 |
2020-06-30 | 0.290 | 0.232 | 0.001 |
RHP Price Target
For more insight on analysts targets of RHP, see our RHP price target page. And for a list of of all stocks sorted by upside potential based on analyst target price, see our Top Price Target page.
Average Price Target | $84.71 | Average Broker Recommendation | 1.79 (Moderate Buy) |
Ryman Hospitality Properties, Inc. (REIT) (RHP) Company Bio
Ryman Hospitality Properties invests in group-oriented, destination hotel assets in urban and resort markets. The company was founded in 1955 and is based in Nashville, Tennessee.
Latest RHP News From Around the Web
Below are the latest news stories about RYMAN HOSPITALITY PROPERTIES INC that investors may wish to consider to help them evaluate RHP as an investment opportunity.
3 Stocks I Bought This WeekMy strategy is simple: Make investments that generate passive income. My goal is to grow my investment income to cover my expenses. Earlier this week, I made three income-focused investments, buying a couple more shares of 3M (NYSE: MMM), Ryman Hospitality Properties (NYSE: RHP), and Regions Financial (NYSE: RF). |
Insider Sell: Director Bowles Alvin L JR Sells 1,384 Shares of Ryman Hospitality Properties IncOn September 19, 2023, Director Bowles Alvin L JR sold 1,384 shares of Ryman Hospitality Properties Inc (NYSE:RHP). |
Ryman Hospitality Properties, Inc. Declares Third Quarter DividendNASHVILLE, Tenn., Sept. 18, 2023 (GLOBE NEWSWIRE) -- Ryman Hospitality Properties (NYSE: RHP) (the “Company”), today announced that the Board of Directors has authorized, and the Company has declared a third quarter cash dividend of $1.00 per common share, to be paid on October 16, 2023, to stockholders of record as of September 29, 2023. About Ryman Hospitality Properties, Inc.Ryman Hospitality Properties, Inc. (NYSE: RHP) is a leading lodging and hospitality real estate investment trust that s |
Ryman Hospitality Properties, Inc. Announces Third Quarter 2023 Earnings Conference Call – Tuesday, November 7, 2023, 10 a.m. ETNASHVILLE, Tenn., Sept. 14, 2023 (GLOBE NEWSWIRE) -- Ryman Hospitality Properties, Inc. (NYSE: RHP) (“RHP”), a leading lodging and hospitality real estate investment trust that specializes in group-oriented, upscale convention center resorts and country music entertainment experiences, announced today that it will release its third quarter 2023 earnings results after the market closes on Monday, November 6, 2023. Management will hold a conference call to discuss the quarter's results at 10:00 a. |
Ryman Hospitality Properties (RHP) Q2 Earnings: Taking a Look at Key Metrics Versus EstimatesWhile the top- and bottom-line numbers for Ryman Hospitality Properties (RHP) give a sense of how the business performed in the quarter ended June 2023, it could be worth looking at how some of its key metrics compare to Wall Street estimates and year-ago values. |
RHP Price Returns
1-mo | N/A |
3-mo | -10.66% |
6-mo | N/A |
1-year | 9.00% |
3-year | 125.10% |
5-year | 13.74% |
YTD | 3.61% |
2022 | -10.67% |
2021 | 35.71% |
2020 | -19.62% |
2019 | 35.74% |
2018 | 0.98% |
RHP Dividends
Ex-Dividend Date | Type | Payout Amount | Change | ||||||
---|---|---|---|---|---|---|---|---|---|
Loading, please wait... |
Continue Researching RHP
Want to see what other sources are saying about Ryman Hospitality Properties Inc's financials and stock price? Try the links below:Ryman Hospitality Properties Inc (RHP) Stock Price | Nasdaq
Ryman Hospitality Properties Inc (RHP) Stock Quote, History and News - Yahoo Finance
Ryman Hospitality Properties Inc (RHP) Stock Price and Basic Information | MarketWatch
Loading social stream, please wait...