Arcadia Biosciences, Inc. (RKDA): Price and Financial Metrics

Arcadia Biosciences, Inc. (RKDA): $2.21

0.09 (-3.91%)

POWR Rating

Component Grades

Momentum

C

Stability

F

Sentiment

Quality

D

Add RKDA to Watchlist
Sign Up

Industry: Agriculture

Industry

D

Ranked

#24 of 28

in industry

RKDA Price/Volume Stats

Current price $2.21 52-week high $8.18
Prev. close $2.30 52-week low $2.12
Day low $2.12 Volume 28,800
Day high $2.30 Avg. volume 20,057
50-day MA $2.57 Dividend yield N/A
200-day MA $3.32 Market Cap 2.45M

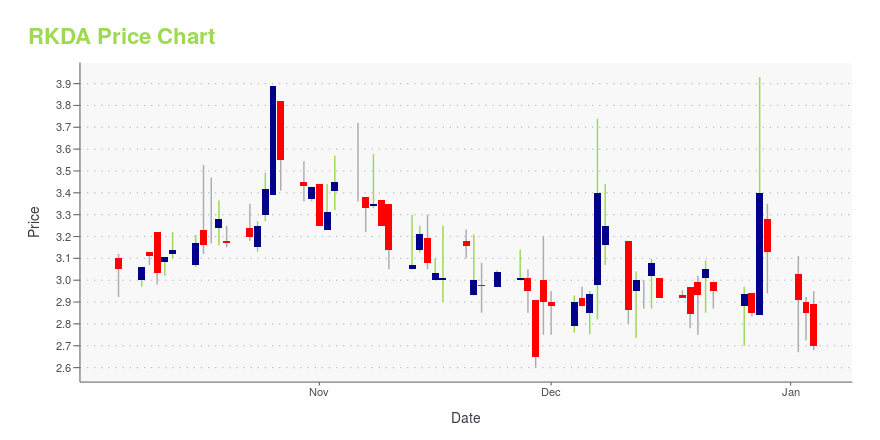
RKDA Stock Price Chart Interactive Chart >

RKDA POWR Grades

  • Sentiment is the dimension where RKDA ranks best; there it ranks ahead of 64.57% of US stocks.
  • RKDA's strongest trending metric is Sentiment; it's been moving down over the last 32 days.
  • RKDA ranks lowest in Stability; there it ranks in the 0th percentile.

RKDA Stock Summary

  • RKDA has a higher market value than just 1.74% of US stocks; more precisely, its current market capitalization is $3,164,460.
  • As for revenue growth, note that RKDA's revenue has grown -50.62% over the past 12 months; that beats the revenue growth of merely 4.64% of US companies in our set.
  • Shareholder yield, a measure of how much is returned to shareholders via dividends and share repurchases, for RKDA comes in at -189.67% -- higher than that of just 2.31% of stocks in our set.
  • Stocks with similar financial metrics, market capitalization, and price volatility to ARCADIA BIOSCIENCES INC are AMRN, TAYD, TNC, SNOA, and EVER.
  • RKDA's SEC filings can be seen here. And to visit ARCADIA BIOSCIENCES INC's official web site, go to www.arcadiabio.com.

RKDA Valuation Summary

  • In comparison to the median Consumer Defensive stock, RKDA's EV/EBIT ratio is 97.71% lower, now standing at 0.4.
  • RKDA's EV/EBIT ratio has moved up 19.2 over the prior 105 months.

Below are key valuation metrics over time for RKDA.

Stock Date P/S P/B P/E EV/EBIT
RKDA 2023-12-22 0.6 0.2 -0.2 0.4
RKDA 2023-12-21 0.6 0.2 -0.2 0.4
RKDA 2023-12-20 0.6 0.2 -0.2 0.4
RKDA 2023-12-19 0.6 0.2 -0.2 0.4
RKDA 2023-12-18 0.6 0.2 -0.2 0.4
RKDA 2023-12-15 0.6 0.2 -0.2 0.4

RKDA Growth Metrics

    Its year over year net cashflow from operations growth rate is now at -1.52%.
  • Its 4 year net cashflow from operations growth rate is now at -34.48%.
  • Its 4 year revenue growth rate is now at -60.64%.
Over the past 67 months, RKDA's revenue has gone up $7,773,000.

The table below shows RKDA's growth in key financial areas (numbers in millions of US dollars).

Date Revenue Operating Cash Flow Net Income to Common Stock
2022-09-30 11.127 -18.281 -20.414
2022-06-30 11.625 -23.178 -19.722
2022-03-31 9.172 -26.046 -21.206
2021-12-31 6.78 -25.868 -14.66
2021-09-30 11.739 -25.959 3.52
2021-06-30 9.677 -24.61 -0.696

RKDA's Quality Factors

The “Quality” component of the POWR Ratings focuses on 31 different factors of a companies fundamentals and operational strength. Here are some key insights as we drill into the specifics of these quality attributes.
  • RKDA has a Quality Grade of D, ranking ahead of 12.03% of graded US stocks.
  • RKDA's asset turnover comes in at 0.174 -- ranking 14th of 16 Agriculture stocks.
  • CVGW, SISI, and ALCO are the stocks whose asset turnover ratios are most correlated with RKDA.

The table below shows RKDA's key quality metrics over time.

Period Asset Turnover Gross Margin ROIC
2021-06-30 0.174 0.378 -0.027
2021-03-31 0.180 0.307 -0.180
2020-12-31 0.212 0.353 -0.196
2020-09-30 0.039 -2.048 -0.944
2020-06-30 0.040 -0.688 -1.479
2020-03-31 0.041 0.273 -0.884

RKDA Price Target

For more insight on analysts targets of RKDA, see our RKDA price target page. And for a list of of all stocks sorted by upside potential based on analyst target price, see our Top Price Target page.

Average Price Target $6.23 Average Broker Recommendation 1.5 (Moderate Buy)

Arcadia Biosciences, Inc. (RKDA) Company Bio


Arcadia Biosciences, Inc. develops and commercializes agricultural products that enhance the environment and human health. It offers crop productivity and product quality traits for various crops. The company was founded in 2002 and is based in Davis, California.


RKDA Latest News Stream


Event/Time News Detail
Loading, please wait...

RKDA Latest Social Stream


Loading social stream, please wait...

View Full RKDA Social Stream

Latest RKDA News From Around the Web

Below are the latest news stories about ARCADIA BIOSCIENCES INC that investors may wish to consider to help them evaluate RKDA as an investment opportunity.

Zacks Industry Outlook Highlights Bunge, The Andersons and Arcadia Biosciences

Bunge, The Andersons and Arcadia Biosciences have been highlighted in this Industry Outlook article.

Yahoo | November 28, 2023

3 Agriculture - Products Stocks to Watch in a Promising Industry

The Agriculture - Products industry is set to gain from solid demand. Stocks like Bunge (BG), Andersons (ANDE) and Arcadia Biosciences (RKDA) are poised to ride on this positive trend.

Yahoo | November 27, 2023

Arcadia Biosciences, Inc. (NASDAQ:RKDA) Q3 2023 Earnings Call Transcript

Arcadia Biosciences, Inc. (NASDAQ:RKDA) Q3 2023 Earnings Call Transcript November 10, 2023 Operator: Good afternoon and welcome to Arcadia Biosciences Third Quarter 2023 Financial Results and Business Highlights Conference Call. [Operator Instructions] Please be advised that today’s conference is being recorded. I would now like to hand the conference over to T.J. Schaefer, Chief Financial […]

Yahoo | November 11, 2023

Q3 2023 Arcadia Biosciences Inc Earnings Call

Q3 2023 Arcadia Biosciences Inc Earnings Call

Yahoo | November 10, 2023

Arcadia Biosciences (RKDA) Announces Strong Third Quarter 2023 Financial Results and Business Highlights

DALLAS, November 09, 2023--Arcadia Biosciences, Inc.® (Nasdaq: RKDA), a producer and marketer of innovative, plant-based health and wellness products, today released its financial and business results for the third quarter of 2023.

Yahoo | November 9, 2023

Read More 'RKDA' Stories Here

RKDA Price Returns

1-mo -23.00%
3-mo -29.39%
6-mo -34.03%
1-year -71.92%
3-year -97.63%
5-year -99.21%
YTD -29.39%
2023 -71.13%
2022 -73.94%
2021 -58.89%
2020 -53.83%
2019 72.87%

Get Free Updates

Join thousands of investors who get the latest news, insights and top rated picks from StockNews.com!