Gibraltar Industries, Inc. (ROCK): Price and Financial Metrics
ROCK Price/Volume Stats
Current price | $80.53 | 52-week high | $87.40 |
Prev. close | $80.56 | 52-week low | $45.73 |
Day low | $79.79 | Volume | 142,000 |
Day high | $81.65 | Avg. volume | 190,756 |
50-day MA | $79.88 | Dividend yield | N/A |
200-day MA | $71.23 | Market Cap | 2.45B |
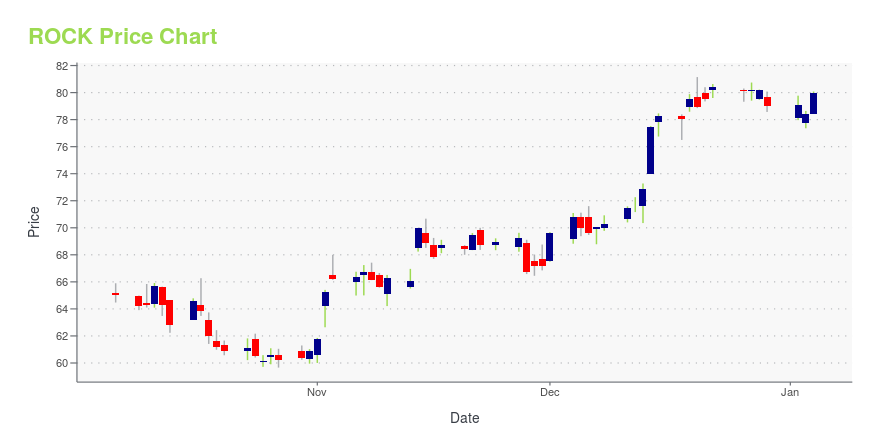
ROCK Stock Price Chart Interactive Chart >
ROCK POWR Grades
- ROCK scores best on the Momentum dimension, with a Momentum rank ahead of 99.42% of US stocks.
- The strongest trend for ROCK is in Growth, which has been heading up over the past 26 weeks.
- ROCK's current lowest rank is in the Value metric (where it is better than 53.31% of US stocks).
ROCK Stock Summary
- Of note is the ratio of GIBRALTAR INDUSTRIES INC's sales and general administrative expense to its total operating expenses; 87.34% of US stocks have a lower such ratio.
- For ROCK, its debt to operating expenses ratio is greater than that reported by just 13.21% of US equities we're observing.
- With a year-over-year growth in debt of -87.91%, GIBRALTAR INDUSTRIES INC's debt growth rate surpasses merely 1.44% of about US stocks.
- If you're looking for stocks that are quantitatively similar to GIBRALTAR INDUSTRIES INC, a group of peers worth examining would be JBSS, HWKN, XPEL, SKY, and WTS.
- Visit ROCK's SEC page to see the company's official filings. To visit the company's web site, go to www.gibraltar1.com.
ROCK Valuation Summary
- In comparison to the median Basic Materials stock, ROCK's price/earnings ratio is 52.69% higher, now standing at 25.5.
- Over the past 243 months, ROCK's price/sales ratio has gone up 1.2.
Below are key valuation metrics over time for ROCK.
Stock | Date | P/S | P/B | P/E | EV/EBIT |
---|---|---|---|---|---|
ROCK | 2023-12-29 | 1.8 | 2.7 | 25.5 | 17.3 |
ROCK | 2023-12-28 | 1.8 | 2.7 | 25.8 | 17.5 |
ROCK | 2023-12-27 | 1.8 | 2.7 | 25.8 | 17.5 |
ROCK | 2023-12-26 | 1.8 | 2.7 | 25.8 | 17.5 |
ROCK | 2023-12-22 | 1.8 | 2.8 | 25.9 | 17.6 |
ROCK | 2023-12-21 | 1.8 | 2.7 | 25.6 | 17.4 |
ROCK Growth Metrics
- The year over year net income to common stockholders growth rate now stands at 20%.
- Its 5 year net income to common stockholders growth rate is now at 162.06%.
- Its 4 year net income to common stockholders growth rate is now at 162.06%.
The table below shows ROCK's growth in key financial areas (numbers in millions of US dollars).
Date | Revenue | Operating Cash Flow | Net Income to Common Stock |
---|---|---|---|
2022-12-31 | 1,389.966 | 102.691 | 82.406 |
2022-09-30 | 1,410.554 | 78.156 | 88.42 |
2022-06-30 | 1,388.616 | 12.839 | 81.681 |
2022-03-31 | 1,370.056 | 18.541 | 78.323 |
2021-12-31 | 1,339.783 | 23.07 | 75.629 |
2021-09-30 | 1,172.994 | 16.385 | 57.722 |
ROCK's Quality Factors
The “Quality” component of the POWR Ratings focuses on 31 different factors of a companies fundamentals and operational strength. Here are some key insights as we drill into the specifics of these quality attributes.- ROCK has a Quality Grade of C, ranking ahead of 58.1% of graded US stocks.
- ROCK's asset turnover comes in at 0.98 -- ranking 21st of 41 Steel Works Etc stocks.
- HAYN, WOR, and AQMS are the stocks whose asset turnover ratios are most correlated with ROCK.
The table below shows ROCK's key quality metrics over time.
Period | Asset Turnover | Gross Margin | ROIC |
---|---|---|---|
2021-09-30 | 0.980 | 0.227 | 0.277 |
2021-06-30 | 0.974 | 0.237 | 0.345 |
2021-03-31 | 0.951 | 0.243 | 0.365 |
2020-12-31 | 0.953 | 0.248 | 0.391 |
2020-09-30 | 1.094 | 0.245 | 0.595 |
2020-06-30 | 1.096 | 0.244 | 0.517 |
ROCK Price Target
For more insight on analysts targets of ROCK, see our ROCK price target page. And for a list of of all stocks sorted by upside potential based on analyst target price, see our Top Price Target page.
Average Price Target | $98.75 | Average Broker Recommendation | 1.38 (Strong Buy) |
Gibraltar Industries, Inc. (ROCK) Company Bio
Gibraltar Industries manufactures and distributes building products. The company operates in two segments, Residential Products, and Industrial and Infrastructure Products. The company was founded in 1993 and is based in Buffalo, New York.
Latest ROCK News From Around the Web
Below are the latest news stories about GIBRALTAR INDUSTRIES INC that investors may wish to consider to help them evaluate ROCK as an investment opportunity.
Does Gibraltar Industries (NASDAQ:ROCK) Deserve A Spot On Your Watchlist?For beginners, it can seem like a good idea (and an exciting prospect) to buy a company that tells a good story to... |
Blueprint to Profit: 3 Top Construction Stocks to Invest In NowThese three construction stocks have been resilient despite the market environment, and we think you should pick them up now. |
Gibraltar Industries (ROCK) Is a Great Choice for 'Trend' Investors, Here's WhyGibraltar Industries (ROCK) could be a great choice for investors looking to make a profit from fundamentally strong stocks that are currently on the move. It is one of the several stocks that made it through our "Recent Price Strength" screen. |
Gibraltar Industries, Inc. (ROCK) Hits Fresh High: Is There Still Room to Run?Gibraltar Industries (ROCK) is at a 52-week high, but can investors hope for more gains in the future? We take a look at the company's fundamentals for clues. |
Here's Why Gibraltar Industries (ROCK) is a Strong Growth StockWondering how to pick strong, market-beating stocks for your investment portfolio? Look no further than the Zacks Style Scores. |
ROCK Price Returns
1-mo | 4.30% |
3-mo | 1.96% |
6-mo | 19.29% |
1-year | 69.29% |
3-year | -10.00% |
5-year | 98.30% |
YTD | 1.96% |
2023 | 72.14% |
2022 | -31.19% |
2021 | -7.31% |
2020 | 42.62% |
2019 | 41.73% |
Continue Researching ROCK
Want to see what other sources are saying about Gibraltar Industries Inc's financials and stock price? Try the links below:Gibraltar Industries Inc (ROCK) Stock Price | Nasdaq
Gibraltar Industries Inc (ROCK) Stock Quote, History and News - Yahoo Finance
Gibraltar Industries Inc (ROCK) Stock Price and Basic Information | MarketWatch
Loading social stream, please wait...