Reliance Steel & Aluminum Co. (RS): Price and Financial Metrics
GET POWR RATINGS... FREE!
RS POWR Grades
- RS scores best on the Quality dimension, with a Quality rank ahead of 94.16% of US stocks.
- RS's strongest trending metric is Quality; it's been moving up over the last 177 days.
- RS ranks lowest in Growth; there it ranks in the 38th percentile.
RS Stock Summary
- RS has a market capitalization of $14,872,868,080 -- more than approximately 87.65% of US stocks.
- The capital turnover (annual revenue relative to shareholder's equity) for RS is 2.4 -- better than 77.93% of US stocks.
- RS's went public 28.55 years ago, making it older than 77.18% of listed US stocks we're tracking.
- If you're looking for stocks that are quantitatively similar to RELIANCE STEEL & ALUMINUM CO, a group of peers worth examining would be WRB, BRO, DGX, SWK, and BEN.
- RS's SEC filings can be seen here. And to visit RELIANCE STEEL & ALUMINUM CO's official web site, go to www.rsac.com.
RS Valuation Summary
- RS's price/sales ratio is 0.9; this is 50% lower than that of the median Basic Materials stock.
- Over the past 243 months, RS's EV/EBIT ratio has gone down 5.
Below are key valuation metrics over time for RS.
Stock | Date | P/S | P/B | P/E | EV/EBIT |
---|---|---|---|---|---|
RS | 2023-03-24 | 0.9 | 2.1 | 8.1 | 6.3 |
RS | 2023-03-23 | 0.9 | 2.1 | 8.0 | 6.2 |
RS | 2023-03-22 | 0.9 | 2.1 | 7.9 | 6.1 |
RS | 2023-03-21 | 0.9 | 2.1 | 8.0 | 6.2 |
RS | 2023-03-20 | 0.9 | 2.1 | 7.9 | 6.1 |
RS | 2023-03-17 | 0.8 | 2.0 | 7.7 | 6.0 |
RS Growth Metrics
- Its year over year cash and equivalents growth rate is now at -27.92%.
- Its 5 year revenue growth rate is now at 19.39%.
- Its 3 year price growth rate is now at 119.4%.

The table below shows RS's growth in key financial areas (numbers in millions of US dollars).
Date | Revenue | Operating Cash Flow | Net Income to Common Stock |
---|---|---|---|
2022-09-30 | 17,402.9 | 1,703.7 | 1,910.9 |
2022-06-30 | 17,003.1 | 1,210.2 | 1,913.1 |
2022-03-31 | 15,740.7 | 1,041.6 | 1,669.4 |
2021-12-31 | 14,093.3 | 799.4 | 1,413 |
2021-09-30 | 12,238.7 | 635.8 | 1,121.3 |
2021-06-30 | 10,476.9 | 789.9 | 823.2 |
RS's Quality Factors
The “Quality” component of the POWR Ratings focuses on 31 different factors of a companies fundamentals and operational strength. Here are some key insights as we drill into the specifics of these quality attributes.- RS has a Quality Grade of B, ranking ahead of 92.12% of graded US stocks.
- RS's asset turnover comes in at 1.248 -- ranking 65th of 105 Wholesale stocks.
- SRLP, GLP, and GEL are the stocks whose asset turnover ratios are most correlated with RS.
The table below shows RS's key quality metrics over time.
Period | Asset Turnover | Gross Margin | ROIC |
---|---|---|---|
2021-06-30 | 1.248 | 0.326 | 0.194 |
2021-03-31 | 1.121 | 0.325 | 0.140 |
2020-12-31 | 1.104 | 0.315 | 0.092 |
2020-09-30 | 1.143 | 0.314 | 0.098 |
2020-06-30 | 1.213 | 0.309 | 0.113 |
2020-03-31 | 1.296 | 0.306 | 0.132 |
RS Price Target
For more insight on analysts targets of RS, see our RS price target page. And for a list of of all stocks sorted by upside potential based on analyst target price, see our Top Price Target page.
Average Price Target | $181.17 | Average Broker Recommendation | 1.64 (Moderate Buy) |
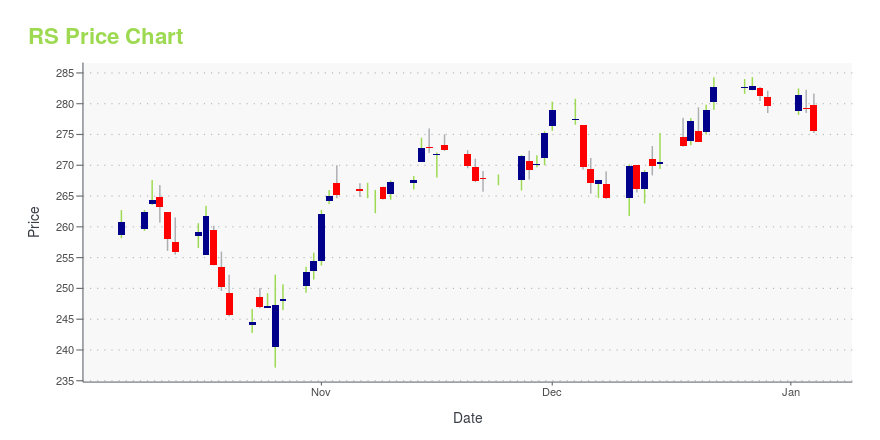
RS Stock Price Chart Interactive Chart >
RS Price/Volume Stats
Current price | $252.47 | 52-week high | $264.42 |
Prev. close | $256.26 | 52-week low | $160.29 |
Day low | $251.37 | Volume | 544,900 |
Day high | $258.80 | Avg. volume | 558,138 |
50-day MA | $240.09 | Dividend yield | 1.56% |
200-day MA | $203.14 | Market Cap | 14.89B |
Reliance Steel & Aluminum Co. (RS) Company Bio
Reliance Steel provides metals processing services and distributes a line of numerous metal products, including alloy, aluminum, brass, copper, carbon steel, stainless steel, titanium, and specialty steel products. The company was founded in 1939 and is based in Los Angeles, California.
Latest RS News From Around the Web
Below are the latest news stories about RELIANCE STEEL & ALUMINUM CO that investors may wish to consider to help them evaluate RS as an investment opportunity.
5 Value Stocks to Buy for Safety Amid Market VolatilityWe have narrowed our search to five value stocks. These are: CAR, RNR, RE, RS, CNO. |
5 Best Investment Opportunities Using Relative Price StrengthPLYA, RS, TGLS, PARR and BWMX are five stocks with explosive relative price strength. |
Reliance Steel (RS) Gains As Market Dips: What You Should KnowReliance Steel (RS) closed the most recent trading day at $256.26, moving +0.03% from the previous trading session. |
Is Reliance Steel & Aluminum Co.'s (NYSE:RS) Stock's Recent Performance Being Led By Its Attractive Financial Prospects?Most readers would already be aware that Reliance Steel & Aluminum's (NYSE:RS) stock increased significantly by 24... |
LyondellBasell (LYB) and EEW to Team Up for Waste SortingThe LyondellBasell (LYB) and EEW collaboration represents an advancement in recycling opportunities. |
RS Price Returns
1-mo | 2.26% |
3-mo | 25.20% |
6-mo | 45.95% |
1-year | 39.10% |
3-year | 201.40% |
5-year | 226.71% |
YTD | 25.20% |
2022 | 27.08% |
2021 | 37.85% |
2020 | 2.42% |
2019 | 72.21% |
2018 | -15.12% |
RS Dividends
Ex-Dividend Date | Type | Payout Amount | Change | ||||||
---|---|---|---|---|---|---|---|---|---|
Loading, please wait... |
Continue Researching RS
Want to do more research on Reliance Steel & Aluminum Co's stock and its price? Try the links below:Reliance Steel & Aluminum Co (RS) Stock Price | Nasdaq
Reliance Steel & Aluminum Co (RS) Stock Quote, History and News - Yahoo Finance
Reliance Steel & Aluminum Co (RS) Stock Price and Basic Information | MarketWatch
Loading social stream, please wait...