Rush Street Interactive, Inc. (RSI): Price and Financial Metrics

Rush Street Interactive, Inc. (RSI): $4.54

0.08 (-1.73%)

POWR Rating

Component Grades

Momentum

C

Stability

D

Sentiment

Quality

D

RSI Price/Volume Stats

Current price $4.54 52-week high $5.48
Prev. close $4.62 52-week low $2.77
Day low $4.48 Volume 501,200
Day high $4.65 Avg. volume 553,255
50-day MA $4.45 Dividend yield N/A
200-day MA $3.70 Market Cap 1.01B

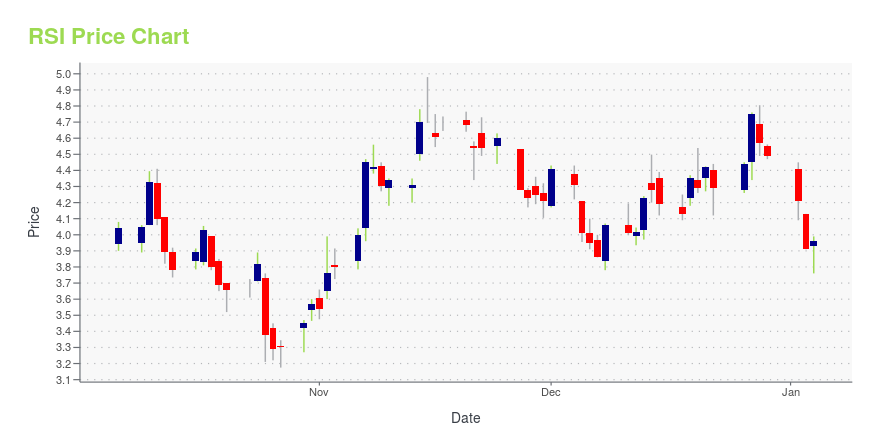
RSI Stock Price Chart Interactive Chart >

RSI POWR Grades

  • Sentiment is the dimension where RSI ranks best; there it ranks ahead of 81.07% of US stocks.
  • RSI's strongest trending metric is Stability; it's been moving down over the last 177 days.
  • RSI ranks lowest in Quality; there it ranks in the 8th percentile.

RSI Stock Summary

  • RUSH STREET INTERACTIVE INC's capital turnover -- a measure of revenue relative to shareholder's equity -- is better than 96.99% of US listed stocks.
  • RUSH STREET INTERACTIVE INC's stock had its IPO on February 21, 2020, making it an older stock than only 15.91% of US equities in our set.
  • The ratio of debt to operating expenses for RUSH STREET INTERACTIVE INC is higher than it is for about just 4.35% of US stocks.
  • If you're looking for stocks that are quantitatively similar to RUSH STREET INTERACTIVE INC, a group of peers worth examining would be BIRD, PETS, CVGW, SND, and G.
  • Visit RSI's SEC page to see the company's official filings. To visit the company's web site, go to www.rushstreetinteractive.com.

RSI Valuation Summary

  • In comparison to the median Consumer Cyclical stock, RSI's price/earnings ratio is 376.67% lower, now standing at -41.5.
  • Over the past 43 months, RSI's price/sales ratio has gone down 2.3.

Below are key valuation metrics over time for RSI.

Stock Date P/S P/B P/E EV/EBIT
RSI 2023-09-13 1.8 23.0 -41.5 -55.0
RSI 2023-09-12 1.9 23.5 -42.4 -56.4
RSI 2023-09-11 1.8 22.7 -41.0 -54.2
RSI 2023-09-08 1.8 23.3 -41.9 -55.7
RSI 2023-09-07 1.8 22.6 -40.8 -53.9
RSI 2023-09-06 1.7 21.3 -38.4 -50.3

RSI's Quality Factors

The “Quality” component of the POWR Ratings focuses on 31 different factors of a companies fundamentals and operational strength. Here are some key insights as we drill into the specifics of these quality attributes.
  • RSI has a Quality Grade of C, ranking ahead of 36.41% of graded US stocks.
  • RSI's asset turnover comes in at 1.483 -- ranking 1st of 44 Entertainment stocks.
  • 500 - Internal server error

The table below shows RSI's key quality metrics over time.

Period Asset Turnover Gross Margin ROIC
2021-06-30 1.483 0.308 -0.068
2021-03-31 1.300 0.307 0.231
2020-12-31 1.109 0.315 0.051
2020-12-31 1.109 0.315 0.030
2020-09-30 0.000 NA -0.013

RSI Price Target

For more insight on analysts targets of RSI, see our RSI price target page. And for a list of of all stocks sorted by upside potential based on analyst target price, see our Top Price Target page.

Average Price Target $21.13 Average Broker Recommendation 1.45 (Moderate Buy)

Rush Street Interactive, Inc. (RSI) Company Bio


Rush Street Interactive, Inc. operates as a gaming company. The Company focuses on developing and operating real money and social gaming online products. Rush Street Interactive serves customers in the United States.


RSI Latest News Stream


Event/Time News Detail
Loading, please wait...

RSI Latest Social Stream


Loading social stream, please wait...

View Full RSI Social Stream

Latest RSI News From Around the Web

Below are the latest news stories about RUSH STREET INTERACTIVE INC that investors may wish to consider to help them evaluate RSI as an investment opportunity.

BETRIVERS LAUNCHES PROP CENTRAL TO KICK OFF THE FOOTBALL SEASON

As the NFL readies to kick into high gear, the BetRivers and PlaySugarHouse sportsbooks are offering props bettors a real treat starting this fall. Just as the sports calendar becomes more crowded, Rush Street Interactive, Inc. (NYSE: RSI) ("RSI"), which operates the BetRivers and PlaySugarHouse sportsbooks, is launching Prop Central, which presents multiple player prop wagering options in one location.

Yahoo | September 7, 2023

3 Tantalizing Stocks to Buy for Under $10

While investors should stick with the predictable ideas, those that want robust returns should target these stocks under $10 to buy.

Josh Enomoto on InvestorPlace | August 26, 2023

Rush Street Interactive Selected by Delaware Lottery as Its Vendor for Online Gaming Operations

CHICAGO, Aug. 17, 2023 (GLOBE NEWSWIRE) -- Rush Street Interactive, Inc. (NYSE: RSI) (“RSI”), a leading online casino and sports betting company in the United States, today announced that it has been selected by the Delaware State Lottery as its vendor for the state’s online gaming business. RSI will provide state-of-the-art online gaming in Delaware for an initial term of 5 years, renewable for additional 1-year terms for an additional 5 years pending regulatory approvals. “We are honored to be

Yahoo | August 17, 2023

Rush Street Interactive Announces Second Quarter 2023 Results

- Second Quarter Revenue of $165.1 Million, up 15% Year-over-Year -- Achieved Adjusted EBITDA Profitability for the Quarter -- Raising Full Year 2023 Revenue Guidance Midpoint with a Revised Range of between $650 and $690 Million - CHICAGO, Aug. 02, 2023 (GLOBE NEWSWIRE) -- Rush Street Interactive, Inc. (NYSE: RSI) (“RSI”), a leading online casino and sports betting company in the United States and the rest of the Americas, today announced financial results for the second quarter ended June 30,

Yahoo | August 2, 2023

Rush Street Interactive Announces Second Quarter 2023 Earnings Release Date

CHICAGO, July 12, 2023 (GLOBE NEWSWIRE) -- Rush Street Interactive, Inc. (NYSE: RSI) (“RSI”) today announced that it will release its second quarter 2023 results after the market close on Wednesday, August 2, 2023, followed by a conference call at 5:00 pm Eastern Time (4:00 pm Central Time) to discuss the results. RSI’s earnings press release and related materials will be available at ir.rushstreetinteractive.com. To listen to the audio webcast and live Q&A, please visit RSI’s investor relations

Yahoo | July 12, 2023

Read More 'RSI' Stories Here

RSI Price Returns

1-mo -1.52%
3-mo 50.33%
6-mo 53.38%
1-year 21.72%
3-year -61.33%
5-year N/A
YTD 26.46%
2022 -78.24%
2021 -23.79%
2020 N/A
2019 N/A
2018 N/A

Get Free Updates

Join thousands of investors who get the latest news, insights and top rated picks from StockNews.com!