
Rightmove PLC (RTMVY): Price and Financial Metrics
RTMVY Price/Volume Stats
| Current price | $14.40 | 52-week high | $15.19 |
| Prev. close | $14.60 | 52-week low | $11.24 |
| Day low | $14.34 | Volume | 30,100 |
| Day high | $14.63 | Avg. volume | 45,852 |
| 50-day MA | $14.21 | Dividend yield | 1.02% |
| 200-day MA | $13.81 | Market Cap | N/A |
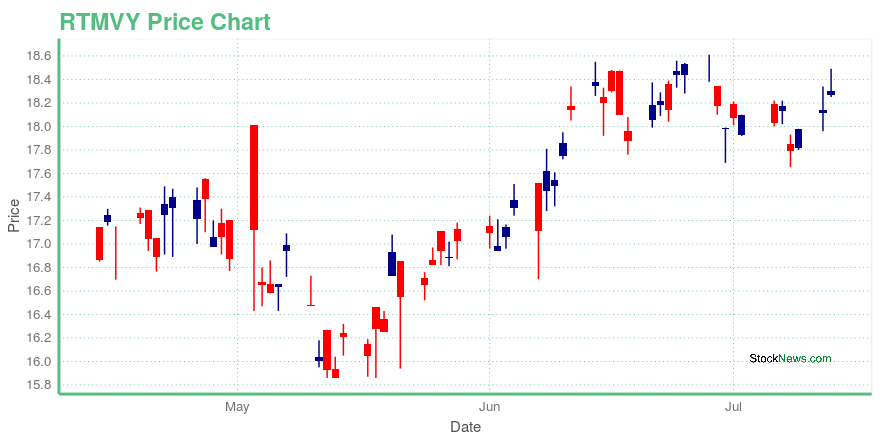
RTMVY Stock Price Chart Interactive Chart >
Rightmove PLC (RTMVY) Company Bio
Rightmove PLC operates a website that lists properties across Britain. The Company also publishes the House Price Index, which shows changes in house prices both annually and monthly and provides a view on the current state of the property market in England and Wales.
RTMVY Price Returns
| 1-mo | 2.13% |
| 3-mo | 12.02% |
| 6-mo | 0.07% |
| 1-year | 1.19% |
| 3-year | -23.08% |
| 5-year | 10.26% |
| YTD | -3.09% |
| 2023 | 20.91% |
| 2022 | -43.08% |
| 2021 | 20.61% |
| 2020 | 6.67% |
| 2019 | 53.95% |
RTMVY Dividends
| Ex-Dividend Date | Type | Payout Amount | Change | ||||||
|---|---|---|---|---|---|---|---|---|---|
| Loading, please wait... | |||||||||
Loading social stream, please wait...