
Ryan Specialty Group Holdings, Inc. (RYAN): Price and Financial Metrics
RYAN Price/Volume Stats
| Current price | $60.61 | 52-week high | $61.29 |
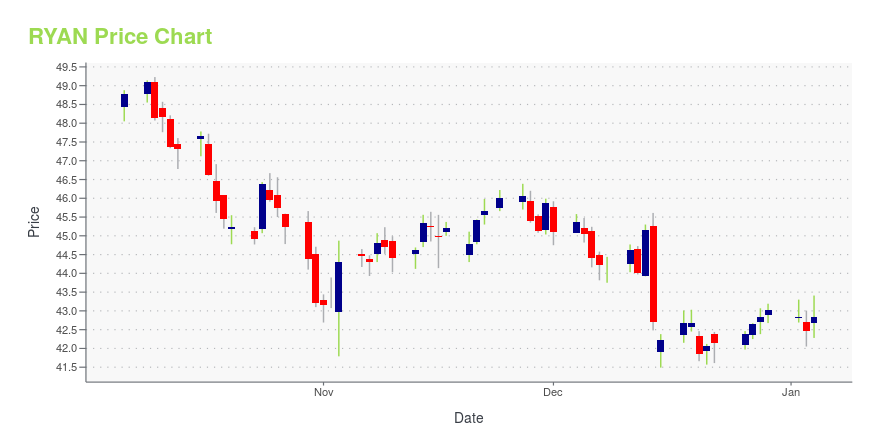
| Prev. close | $59.09 | 52-week low | $41.49 |
| Day low | $59.13 | Volume | 901,500 |
| Day high | $60.98 | Avg. volume | 894,694 |
| 50-day MA | $56.27 | Dividend yield | 0.74% |
| 200-day MA | $49.63 | Market Cap | 15.79B |
RYAN Stock Price Chart Interactive Chart >
Ryan Specialty Group Holdings, Inc. (RYAN) Company Bio
Ryan Specialty Group Holdings, Inc. provides specialty insurance solutions for insurance brokers, agents, and carriers. It distributes a range of specialty property, casualty, professional lines, personal lines, and workers' compensation insurance products, as well as offers underwriting, product development, administration, and risk management services. The company was founded in 2010 and is headquartered in Chicago, Illinois.
Latest RYAN News From Around the Web
Below are the latest news stories about RYAN SPECIALTY HOLDINGS INC that investors may wish to consider to help them evaluate RYAN as an investment opportunity.
Ryan Specialty Signs Definitive Agreement To Acquire Castel Underwriting AgenciesCHICAGO, December 21, 2023--Ryan Specialty (NYSE: RYAN), a leading international specialty insurance firm, is pleased to announce it has signed a definitive agreement to acquire Castel Underwriting Agencies Limited ("Castel"), a Managing General Underwriting (MGU) platform, from Arch Financial Holdings (UK) Limited and minority shareholders. Castel is headquartered in London, England with additional offices in the Netherlands and Belgium and was founded in 2014. |
Ryan Specialty Completes Acquisition of AccuRisk HoldingsCHICAGO, December 01, 2023--Ryan Specialty (NYSE: RYAN), a leading international specialty insurance firm, is pleased to announce that it completed the acquisition of AccuRisk Holdings, LLC ("AccuRisk"), a medical stop loss managing general underwriter (MGU). AccuRisk is headquartered in Chicago, IL and was founded in 2017. The previous announcement dated October 30, 2023 regarding the signing of the definitive agreement can be found here. |
Ryan Specialty to Participate in the Goldman Sachs Financial Services ConferenceCHICAGO, November 29, 2023--Ryan Specialty Holdings, Inc. (NYSE: RYAN) ("Ryan Specialty"), a leading international specialty insurance firm, today announced that its Chairman and Chief Executive Officer, Patrick G. Ryan, its President, Timothy W. Turner, its Chief Financial Officer, Jeremiah R. Bickham, and President & CEO of Ryan Specialty Underwriting Managers, Miles Wuller, will participate in a fireside chat at the Goldman Sachs Financial Services Conference on Wednesday, December 6, 2023 at |
11 Undervalued Insurance Stocks To Buy NowIn this piece, we will take a look at the 11 undervalued insurance stocks to buy now. If you want to skip our overview of the insurance industry and some recent trends, then take a look at 5 Undervalued Insurance Stocks To Buy Now. The insurance industry is one of the oldest in the world. […] |
Arthur J. Gallagher (AJG) Boosts Ireland Presence With BuyoutArthur J. Gallagher's (AJG) buyout of Keaney Insurance is set to help it consolidate its presence in Ireland. |
RYAN Price Returns
| 1-mo | 3.70% |
| 3-mo | 24.10% |
| 6-mo | 38.94% |
| 1-year | 39.64% |
| 3-year | 106.14% |
| 5-year | N/A |
| YTD | 42.07% |
| 2023 | 3.64% |
| 2022 | 2.88% |
| 2021 | N/A |
| 2020 | N/A |
| 2019 | N/A |
RYAN Dividends
| Ex-Dividend Date | Type | Payout Amount | Change | ||||||
|---|---|---|---|---|---|---|---|---|---|
| Loading, please wait... | |||||||||
Loading social stream, please wait...