Ryerson Holding Corporation (RYI): Price and Financial Metrics
GET POWR RATINGS... FREE!
RYI POWR Grades
- Value is the dimension where RYI ranks best; there it ranks ahead of 99.51% of US stocks.
- RYI's strongest trending metric is Growth; it's been moving down over the last 177 days.
- RYI's current lowest rank is in the Growth metric (where it is better than 20.66% of US stocks).
RYI Stock Summary
- RYI's current price/earnings ratio is 2.84, which is higher than merely 3.49% of US stocks with positive earnings.
- Of note is the ratio of RYERSON HOLDING CORP's sales and general administrative expense to its total operating expenses; 97.03% of US stocks have a lower such ratio.
- RYI's price/sales ratio is 0.23; that's higher than the P/S ratio of only 4.89% of US stocks.
- Stocks that are quantitatively similar to RYI, based on their financial statements, market capitalization, and price volatility, are M, AVT, SPWH, MAN, and PDCO.
- Visit RYI's SEC page to see the company's official filings. To visit the company's web site, go to www.ryerson.com.
RYI Valuation Summary
- RYI's price/earnings ratio is 2.4; this is 88.21% lower than that of the median Industrials stock.
- Over the past 103 months, RYI's price/earnings ratio has gone down 0.2.
Below are key valuation metrics over time for RYI.
Stock | Date | P/S | P/B | P/E | EV/EBIT |
---|---|---|---|---|---|
RYI | 2023-01-24 | 0.2 | 1.4 | 2.4 | 2.6 |
RYI | 2023-01-23 | 0.2 | 1.4 | 2.4 | 2.6 |
RYI | 2023-01-20 | 0.2 | 1.4 | 2.4 | 2.6 |
RYI | 2023-01-19 | 0.2 | 1.4 | 2.3 | 2.6 |
RYI | 2023-01-18 | 0.2 | 1.3 | 2.3 | 2.5 |
RYI | 2023-01-17 | 0.2 | 1.4 | 2.3 | 2.5 |
RYI Growth Metrics
- Its 3 year cash and equivalents growth rate is now at 98.27%.
- Its 4 year net income to common stockholders growth rate is now at 246.5%.
- Its 2 year cash and equivalents growth rate is now at -77.63%.

The table below shows RYI's growth in key financial areas (numbers in millions of US dollars).
Date | Revenue | Operating Cash Flow | Net Income to Common Stock |
---|---|---|---|
2022-09-30 | 6,569.3 | 426.4 | 521.5 |
2022-06-30 | 6,601.3 | 254.1 | 516.1 |
2022-03-31 | 6,276.8 | 164.8 | 432.6 |
2021-12-31 | 5,675.3 | 35 | 294.3 |
2021-09-30 | 4,994.4 | -90.6 | 171.2 |
2021-06-30 | 4,250.8 | 50.7 | 81.6 |
RYI's Quality Factors
The “Quality” component of the POWR Ratings focuses on 31 different factors of a companies fundamentals and operational strength. Here are some key insights as we drill into the specifics of these quality attributes.- RYI has a Quality Grade of B, ranking ahead of 87.55% of graded US stocks.
- RYI's asset turnover comes in at 2.361 -- ranking 26th of 105 Wholesale stocks.
- SGBX, GWW, and CAPL are the stocks whose asset turnover ratios are most correlated with RYI.
The table below shows RYI's key quality metrics over time.
Period | Asset Turnover | Gross Margin | ROIC |
---|---|---|---|
2021-09-30 | 2.361 | 0.195 | 0.143 |
2021-06-30 | 2.163 | 0.180 | 0.086 |
2021-03-31 | 1.928 | 0.173 | -0.004 |
2020-12-31 | 1.798 | 0.179 | -0.007 |
2020-09-30 | 1.803 | 0.181 | 0.021 |
2020-06-30 | 1.874 | 0.181 | 0.053 |
RYI Price Target
For more insight on analysts targets of RYI, see our RYI price target page. And for a list of of all stocks sorted by upside potential based on analyst target price, see our Top Price Target page.
Average Price Target | $20.00 | Average Broker Recommendation | 2 (Hold) |
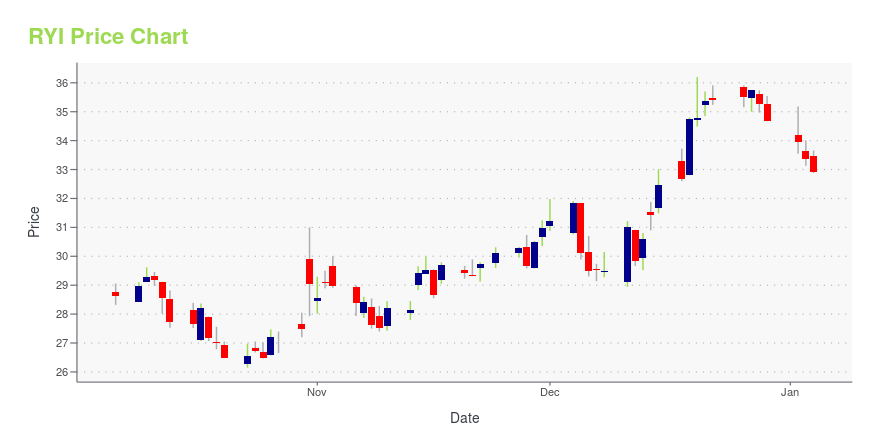
RYI Stock Price Chart Interactive Chart >
RYI Price/Volume Stats
Current price | $40.44 | 52-week high | $44.09 |
Prev. close | $39.95 | 52-week low | $18.68 |
Day low | $39.46 | Volume | 146,100 |
Day high | $41.12 | Avg. volume | 177,322 |
50-day MA | $32.04 | Dividend yield | 1.6% |
200-day MA | $29.34 | Market Cap | 1.50B |
Ryerson Holding Corporation (RYI) Company Bio
Ryerson Holding Corporation processes and distributes various metals in in the United States, Mexico, Canada, China, and Brazil. The company was founded in 1842 and is based in Chicago, Illinois.
Latest RYI News From Around the Web
Below are the latest news stories about RYERSON HOLDING CORP that investors may wish to consider to help them evaluate RYI as an investment opportunity.
Are Investors Undervaluing Commercial Metals (CMC) Right Now?Here at Zacks, our focus is on the proven Zacks Rank system, which emphasizes earnings estimates and estimate revisions to find great stocks. Nevertheless, we are always paying attention to the latest value, growth, and momentum trends to underscore strong picks. |
Ryerson to Host Earnings Call on Thursday, February 23 to Discuss Fourth Quarter and Full-Year 2022 ResultsRyerson Holding Corporation (NYSE: RYI), a leading value-added processor and distributor of industrial metals, announced today that it will host a conference call to discuss fourth quarter and full-year 2022 financial results for the period ended December 31, 2022, on Thursday, February 23rd, at 10 a.m. Eastern Time. The live online broadcast will be available on the Company's Investor Relations website, ir.ryerson.com. Ryerson will report earnings after the market close on Wednesday, February 2 |
Looking for a Fast-paced Momentum Stock at a Bargain? Consider Ryerson (RYI)Ryerson (RYI) could be a great choice for investors looking to buy stocks that have gained strong momentum recently but are still trading at reasonable prices. It is one of the several stocks that made it through our 'Fast-Paced Momentum at a Bargain' screen. |
Are Investors Undervaluing Aperam (APEMY) Right Now?Here at Zacks, our focus is on the proven Zacks Rank system, which emphasizes earnings estimates and estimate revisions to find great stocks. Nevertheless, we are always paying attention to the latest value, growth, and momentum trends to underscore strong picks. |
Ryerson Holding (NYSE:RYI) Knows How To Allocate Capital EffectivelyIf we want to find a stock that could multiply over the long term, what are the underlying trends we should look for... |
RYI Price Returns
1-mo | 32.07% |
3-mo | 51.83% |
6-mo | 54.64% |
1-year | 99.22% |
3-year | 307.33% |
5-year | 325.29% |
YTD | 33.64% |
2022 | 18.34% |
2021 | 92.22% |
2020 | 15.30% |
2019 | 86.59% |
2018 | -39.04% |
RYI Dividends
Ex-Dividend Date | Type | Payout Amount | Change | ||||||
---|---|---|---|---|---|---|---|---|---|
Loading, please wait... |
Continue Researching RYI
Want to see what other sources are saying about Ryerson Holding Corp's financials and stock price? Try the links below:Ryerson Holding Corp (RYI) Stock Price | Nasdaq
Ryerson Holding Corp (RYI) Stock Quote, History and News - Yahoo Finance
Ryerson Holding Corp (RYI) Stock Price and Basic Information | MarketWatch
Loading social stream, please wait...