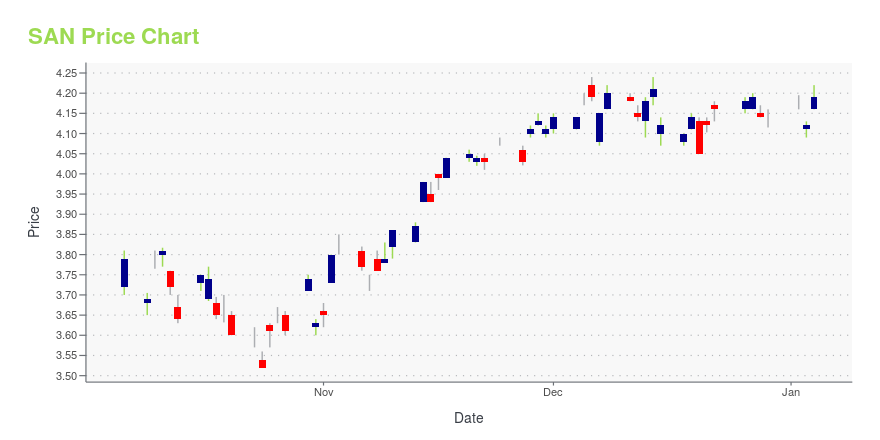
Banco Santander S.A. ADR (SAN): Price and Financial Metrics
SAN Price/Volume Stats
| Current price | $4.49 | 52-week high | $5.27 |
| Prev. close | $4.46 | 52-week low | $3.83 |
| Day low | $4.46 | Volume | 3,223,300 |
| Day high | $4.50 | Avg. volume | 3,148,700 |
| 50-day MA | $4.74 | Dividend yield | 3.49% |
| 200-day MA | $4.84 | Market Cap | 71.06B |
SAN Stock Price Chart Interactive Chart >
Banco Santander S.A. ADR (SAN) Company Bio
Banco Santander, S.A., doing business as Santander Group (UK: /ˌsæntənˈdɛər, -tæn-/, US: /ˌsɑːntɑːnˈdɛər/, Spanish: [santanˈdeɾ]), is a Spanish multinational financial services company based in Madrid and Santander in Spain. Additionally, Santander maintains a presence in all global financial centres as the 16th-largest banking institution in the world. Although known for its European banking operations, it has extended operations across North and South America, and more recently in continental Asia. It is considered a systemically important bank by Financial Stability Board. (Source:Wikipedia)
SAN Price Returns
| 1-mo | -7.80% |
| 3-mo | -8.92% |
| 6-mo | -3.12% |
| 1-year | 9.16% |
| 3-year | 38.20% |
| 5-year | 19.63% |
| YTD | -1.54% |
| 2024 | 13.53% |
| 2023 | 44.41% |
| 2022 | -7.89% |
| 2021 | 8.94% |
| 2020 | -26.33% |
SAN Dividends
| Ex-Dividend Date | Type | Payout Amount | Change | ||||||
|---|---|---|---|---|---|---|---|---|---|
| Loading, please wait... | |||||||||


Loading social stream, please wait...