
S&W Seed Company (SANW): Price and Financial Metrics
SANW Price/Volume Stats
| Current price | $0.40 | 52-week high | $1.26 |
| Prev. close | $0.40 | 52-week low | $0.24 |
| Day low | $0.38 | Volume | 102,100 |
| Day high | $0.40 | Avg. volume | 91,018 |
| 50-day MA | $0.31 | Dividend yield | N/A |
| 200-day MA | $0.50 | Market Cap | 17.34M |
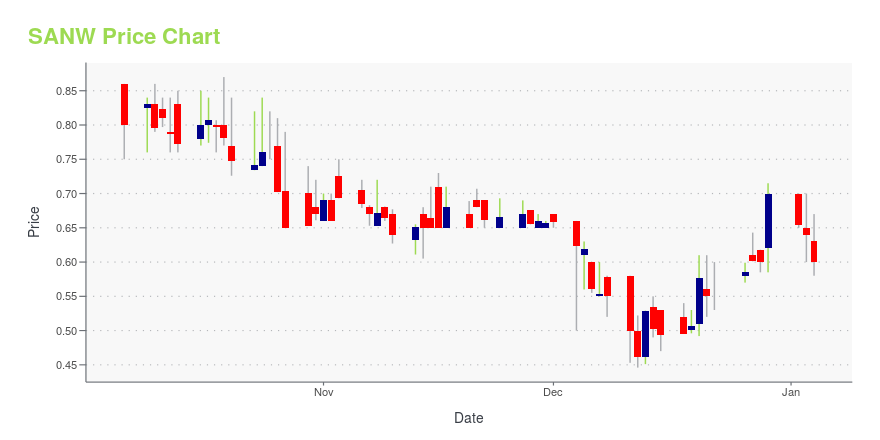
SANW Stock Price Chart Interactive Chart >
S&W Seed Company (SANW) Company Bio
S&W Seed Company, an agricultural company, engages in breeding, growing, processing, and selling alfalfa seeds. S&W Seed Company was founded in 1980 and is based in Hanford, California.
Latest SANW News From Around the Web
Below are the latest news stories about S&W SEED CO that investors may wish to consider to help them evaluate SANW as an investment opportunity.
S&W Seed Company Appoints Jeffrey Rona to Its Board of DirectorsS&W Seed Company (Nasdaq: SANW), a global agricultural technology company, today announced the nomination of senior biotechnology executive Jeffrey Rona to its Board of Directors. |
Why S&W Seed Company (NASDAQ:SANW) Could Be Worth WatchingS&W Seed Company ( NASDAQ:SANW ), might not be a large cap stock, but it received a lot of attention from a substantial... |
S&W Seed Company (NASDAQ:SANW) Q1 2024 Earnings Call TranscriptS&W Seed Company (NASDAQ:SANW) Q1 2024 Earnings Call Transcript November 9, 2023 S&W Seed Company misses on earnings expectations. Reported EPS is $-0.11 EPS, expectations were $-0.1. Operator: Good morning, everyone, and welcome to the S&W Seed Company Reports First Quarter Fiscal Year 2024 Financial Results Conference Call. All participants will be in a listen-only […] |
Q1 2024 S&W Seed Co Earnings CallQ1 2024 S&W Seed Co Earnings Call |
S&W Seed Co (SANW) Reports Mixed Q1 Fiscal 2024 Results Amid Operational ChallengesRevenue Declines but Gross Profit Margin Improves; Company Focuses on Strategic Initiatives |
SANW Price Returns
| 1-mo | 10.80% |
| 3-mo | -4.76% |
| 6-mo | -27.40% |
| 1-year | -66.94% |
| 3-year | -88.30% |
| 5-year | -86.62% |
| YTD | -42.86% |
| 2023 | -53.02% |
| 2022 | -45.42% |
| 2021 | -6.83% |
| 2020 | 39.52% |
| 2019 | 16.02% |
Continue Researching SANW
Want to do more research on S&W Seed Co's stock and its price? Try the links below:S&W Seed Co (SANW) Stock Price | Nasdaq
S&W Seed Co (SANW) Stock Quote, History and News - Yahoo Finance
S&W Seed Co (SANW) Stock Price and Basic Information | MarketWatch
Loading social stream, please wait...