Superior Drilling Products, Inc. (SDPI): Price and Financial Metrics
SDPI Price/Volume Stats
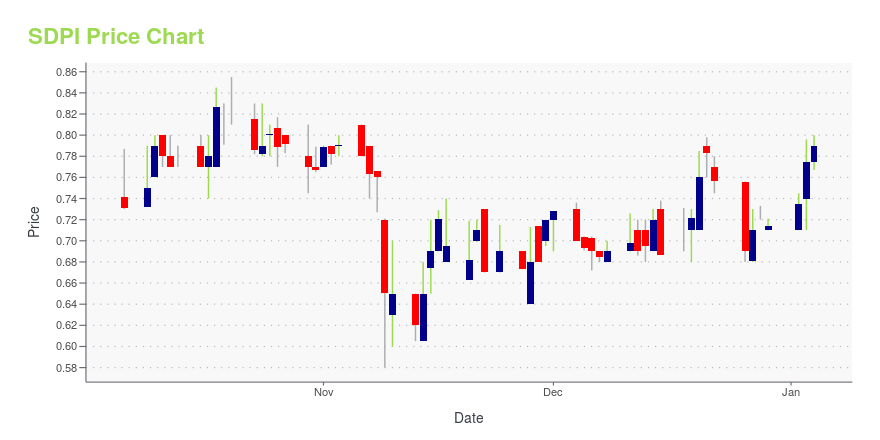
Current price | $0.91 | 52-week high | $2.21 |
Prev. close | $0.90 | 52-week low | $0.58 |
Day low | $0.90 | Volume | 89,521 |
Day high | $0.92 | Avg. volume | 86,806 |
50-day MA | $0.78 | Dividend yield | N/A |
200-day MA | $0.89 | Market Cap | 27.75M |
SDPI Stock Price Chart Interactive Chart >
SDPI POWR Grades
- SDPI scores best on the Momentum dimension, with a Momentum rank ahead of 97.38% of US stocks.
- The strongest trend for SDPI is in Value, which has been heading up over the past 78 days.
- SDPI's current lowest rank is in the Stability metric (where it is better than 23.81% of US stocks).
SDPI Stock Summary
- SDPI has a market capitalization of $23,553,211 -- more than approximately just 9.56% of US stocks.
- The price/operating cash flow metric for SUPERIOR DRILLING PRODUCTS INC is higher than only 12.72% of stocks in our set with a positive cash flow.
- Over the past twelve months, SDPI has reported earnings growth of 55.1%, putting it ahead of 83.27% of US stocks in our set.
- Stocks that are quantitatively similar to SDPI, based on their financial statements, market capitalization, and price volatility, are BOOM, SND, WTTR, DTC, and ATKR.
- Visit SDPI's SEC page to see the company's official filings. To visit the company's web site, go to www.sdpi.com.
SDPI Valuation Summary
- SDPI's price/sales ratio is 1; this is 37.5% lower than that of the median Energy stock.
- Over the past 117 months, SDPI's EV/EBIT ratio has gone down 10.6.
Below are key valuation metrics over time for SDPI.
Stock | Date | P/S | P/B | P/E | EV/EBIT |
---|---|---|---|---|---|
SDPI | 2023-12-28 | 1.0 | 2.1 | 10.0 | 7.7 |
SDPI | 2023-12-27 | 1.0 | 2.0 | 9.9 | 7.6 |
SDPI | 2023-12-26 | 1.0 | 2.0 | 9.6 | 7.4 |
SDPI | 2023-12-22 | 1.0 | 2.2 | 10.5 | 8.1 |
SDPI | 2023-12-21 | 1.1 | 2.2 | 10.9 | 8.3 |
SDPI | 2023-12-20 | 1.1 | 2.2 | 10.6 | 8.1 |
SDPI Growth Metrics
- Its 3 year price growth rate is now at -5.64%.
- Its 5 year price growth rate is now at -15.06%.
- The year over year cash and equivalents growth rate now stands at 26.16%.
The table below shows SDPI's growth in key financial areas (numbers in millions of US dollars).
Date | Revenue | Operating Cash Flow | Net Income to Common Stock |
---|---|---|---|
2022-09-30 | 17.79402 | 0.984546 | 1.377045 |
2022-06-30 | 16.18339 | 1.479839 | 0.732103 |
2022-03-31 | 15.04166 | 1.469899 | 0.72183 |
2021-12-31 | 13.33615 | 0.526156 | -0.529801 |
2021-09-30 | 10.92689 | 0.184634 | -1.829926 |
2021-06-30 | 8.912409 | -1.135347 | -3.554988 |
Superior Drilling Products, Inc. (SDPI) Company Bio
Superior Drilling Products, Inc. manufactures new and re-manufactured diamond drill bits and drill string components. The Company offers its products to the oil, natural gas, and mining drilling industries.
Latest SDPI News From Around the Web
Below are the latest news stories about SUPERIOR DRILLING PRODUCTS INC that investors may wish to consider to help them evaluate SDPI as an investment opportunity.
Q3 2023 Superior Drilling Products Inc Earnings CallQ3 2023 Superior Drilling Products Inc Earnings Call |
Superior Drilling Products Reports Third Quarter 2023 ResultsVERNAL, Utah, November 09, 2023--Superior Drilling Products Reports Third Quarter 2023 Results |
Superior Drilling Products to Report Third Quarter 2023 Financial Results and Host Conference Call on November 9VERNAL, Utah, October 26, 2023--Superior Drilling Products to Report Third Quarter 2023 Financial Results and Host Conference Call on November 9 |
iAccess Alpha Best Ideas from the Buyside Virtual Conference - Sep 26th-27th 2023RALEIGH, NC / ACCESSWIRE / September 25, 2023 / iAccess Alpha's Top 10 Best Ideas from the buyside virtual conference is taking place September 26th & 27th, 2023.The conference begins on Tuesday, September 26th, 2023, with company presentations beginning ... |
Superior Drilling Products, Inc. to Webcast Presentation at iAccess Alpha's Virtual Microcap ConferenceSuperior Drilling Products, Inc. (NYSE American:SDPI) ("SDP" or the "Company"), a designer and manufacturer of drilling tool technologies, announced that Troy Meier, Chairman and Chief Executive Officer, and Christopher Cashion, Chief Financial Officer, will present and be available for investor meetings at iAccess Alpha's Virtual Microcap Conference on September 26 and 27, 2023. |
SDPI Price Returns
1-mo | 29.63% |
3-mo | 27.45% |
6-mo | 13.76% |
1-year | -0.03% |
3-year | -3.19% |
5-year | -31.06% |
YTD | 27.45% |
2023 | -22.32% |
2022 | 25.85% |
2021 | 20.77% |
2020 | -26.26% |
2019 | -29.91% |
Continue Researching SDPI
Want to do more research on Superior Drilling Products Inc's stock and its price? Try the links below:Superior Drilling Products Inc (SDPI) Stock Price | Nasdaq
Superior Drilling Products Inc (SDPI) Stock Quote, History and News - Yahoo Finance
Superior Drilling Products Inc (SDPI) Stock Price and Basic Information | MarketWatch
Loading social stream, please wait...