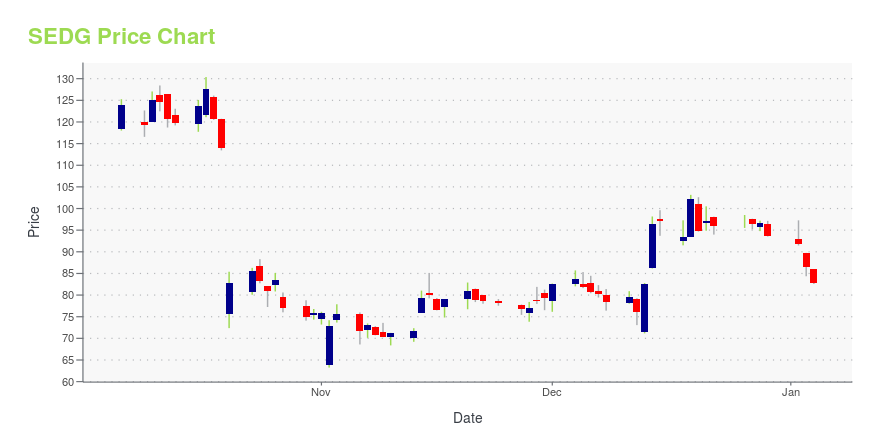
SolarEdge Technologies Inc. (SEDG): Price and Financial Metrics
SEDG Price/Volume Stats
| Current price | $27.57 | 52-week high | $248.82 |
| Prev. close | $27.45 | 52-week low | $23.51 |
| Day low | $27.43 | Volume | 3,134,600 |
| Day high | $28.95 | Avg. volume | 3,157,982 |
| 50-day MA | $36.86 | Dividend yield | N/A |
| 200-day MA | $65.97 | Market Cap | 1.58B |
SEDG Stock Price Chart Interactive Chart >
SolarEdge Technologies Inc. (SEDG) Company Bio
SolarEdge is an Israeli company that develops and sells solar inverters for photovoltaic arrays, energy generation monitoring software, battery energy storage products, as well as other related products and services to residential, commercial and industrial customers. Established in 2006, the company also has offices in Germany, Italy, Japan, and United States. It is incorporated in Delaware. The company was the first to successfully commercialize power optimizers, a device that offers module-level maximum power point tracking (MPPT), before feeding back the electricity generated into a central inverter. (Source:Wikipedia)
Latest SEDG News From Around the Web
Below are the latest news stories about SOLAREDGE TECHNOLOGIES INC that investors may wish to consider to help them evaluate SEDG as an investment opportunity.
Why These 3 Solar Stocks Should Be on Your Radar in 2024These are the undervalued solar stocks to buy. |
Should Weakness in SolarEdge Technologies, Inc.'s (NASDAQ:SEDG) Stock Be Seen As A Sign That Market Will Correct The Share Price Given Decent Financials?SolarEdge Technologies (NASDAQ:SEDG) has had a rough three months with its share price down 26%. But if you pay close... |
SolarEdge Technologies (SEDG) Stock Declines While Market Improves: Some Information for InvestorsIn the most recent trading session, SolarEdge Technologies (SEDG) closed at $96.03, indicating a -1.08% shift from the previous trading day. |
12 Best Tech Stocks To Buy On the DipIn this article, we discuss the 12 best tech stocks to buy on the dip. If you want to skip our detailed analysis of these stocks, go directly to 5 Best Tech Stocks To Buy On the Dip. Technology stocks were the winners of the pandemic, climbing to record highs during lockdowns as businesses scrambled […] |
Analysts on Wall Street Lower Ratings for These 10 StocksIn this article, we will discuss the 10 stocks recently downgraded by analysts. If you want to see more such stocks on the list, you can directly visit Analysts on Wall Street Lower Ratings for These 5 Stocks. European financial markets experienced significant movements on Wednesday, with stocks recording gains and bond yields across the euro […] |
SEDG Price Returns
| 1-mo | 9.10% |
| 3-mo | -52.63% |
| 6-mo | -61.31% |
| 1-year | -88.36% |
| 3-year | -89.15% |
| 5-year | -57.14% |
| YTD | -70.54% |
| 2023 | -66.96% |
| 2022 | 0.96% |
| 2021 | -12.08% |
| 2020 | 235.60% |
| 2019 | 170.91% |
Continue Researching SEDG
Here are a few links from around the web to help you further your research on Solaredge Technologies Inc's stock as an investment opportunity:Solaredge Technologies Inc (SEDG) Stock Price | Nasdaq
Solaredge Technologies Inc (SEDG) Stock Quote, History and News - Yahoo Finance
Solaredge Technologies Inc (SEDG) Stock Price and Basic Information | MarketWatch


Loading social stream, please wait...