Stitch Fix, Inc. - (SFIX): Price and Financial Metrics

Stitch Fix, Inc. - (SFIX): $2.64

0.20 (+8.20%)

POWR Rating

Component Grades

Momentum

C

Stability

D

Sentiment

Quality

C

Add SFIX to Watchlist
Sign Up

Industry: Internet - Services

Industry

D

Ranked

#15 of 28

in industry

SFIX Price/Volume Stats

Current price $2.64 52-week high $5.20
Prev. close $2.44 52-week low $2.15
Day low $2.44 Volume 1,653,200
Day high $2.67 Avg. volume 1,628,831
50-day MA $3.02 Dividend yield N/A
200-day MA $3.56 Market Cap 317.25M

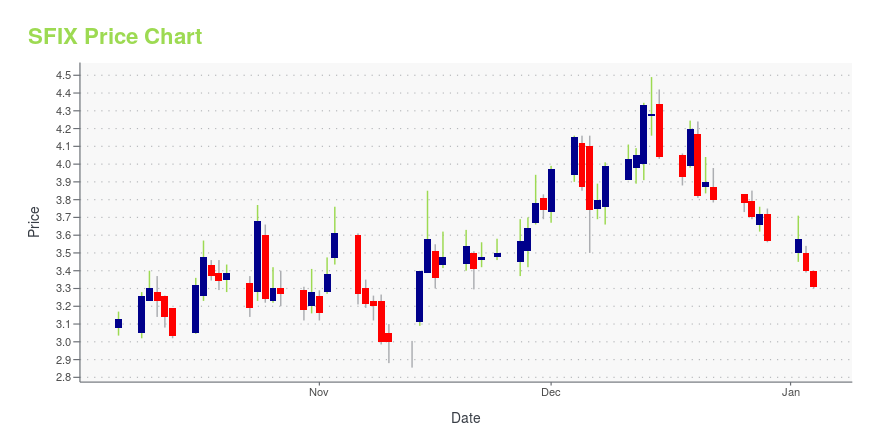
SFIX Stock Price Chart Interactive Chart >

SFIX POWR Grades

  • Growth is the dimension where SFIX ranks best; there it ranks ahead of 90.32% of US stocks.
  • The strongest trend for SFIX is in Value, which has been heading up over the past 26 weeks.
  • SFIX ranks lowest in Stability; there it ranks in the 7th percentile.

SFIX Stock Summary

  • STITCH FIX INC's capital turnover -- a measure of revenue relative to shareholder's equity -- is better than 94.02% of US listed stocks.
  • Of note is the ratio of STITCH FIX INC's sales and general administrative expense to its total operating expenses; 87.34% of US stocks have a lower such ratio.
  • SFIX's price/sales ratio is 0.26; that's higher than the P/S ratio of merely 7.85% of US stocks.
  • Stocks that are quantitatively similar to SFIX, based on their financial statements, market capitalization, and price volatility, are LVLU, CMT, PRPO, GIFI, and CMC.
  • SFIX's SEC filings can be seen here. And to visit STITCH FIX INC's official web site, go to www.stitchfix.com.

SFIX Valuation Summary

  • SFIX's EV/EBIT ratio is -2.1; this is 113.73% lower than that of the median Consumer Cyclical stock.
  • Over the past 74 months, SFIX's price/earnings ratio has gone up 2456.1.

Below are key valuation metrics over time for SFIX.

Stock Date P/S P/B P/E EV/EBIT
SFIX 2023-12-29 0.3 1.8 -2.8 -2.1
SFIX 2023-12-28 0.3 1.9 -2.9 -2.2
SFIX 2023-12-27 0.3 1.9 -2.9 -2.2
SFIX 2023-12-26 0.3 1.9 -2.9 -2.2
SFIX 2023-12-22 0.3 1.9 -3.0 -2.2
SFIX 2023-12-21 0.3 2.0 -3.0 -2.3

SFIX's Quality Factors

The “Quality” component of the POWR Ratings focuses on 31 different factors of a companies fundamentals and operational strength. Here are some key insights as we drill into the specifics of these quality attributes.
  • SFIX has a Quality Grade of C, ranking ahead of 54.74% of graded US stocks.
  • SFIX's asset turnover comes in at 2.48 -- ranking 26th of 165 Retail stocks.
  • 500 - Internal server error

The table below shows SFIX's key quality metrics over time.

Period Asset Turnover Gross Margin ROIC
2021-07-31 2.480 0.451 -0.106
2021-05-01 2.364 0.447 -0.167
2021-01-30 2.202 0.435 -0.201
2020-10-31 2.176 0.440 -0.115
2020-08-01 2.175 0.441 -0.081
2020-05-02 2.271 0.438 -0.060

SFIX Price Target

For more insight on analysts targets of SFIX, see our SFIX price target page. And for a list of of all stocks sorted by upside potential based on analyst target price, see our Top Price Target page.

Average Price Target $60.73 Average Broker Recommendation 1.88 (Hold)

Stitch Fix, Inc. - (SFIX) Company Bio


Stitch Fix, Inc. operates as an online subscription and personal shopping platform. The Company offers shirt, jacket, sweater, blazer, leggings, vests, scarf, jeans, loafers, and boots for men and women.


SFIX Latest News Stream


Event/Time News Detail
Loading, please wait...

SFIX Latest Social Stream


Loading social stream, please wait...

View Full SFIX Social Stream

Latest SFIX News From Around the Web

Below are the latest news stories about STITCH FIX INC that investors may wish to consider to help them evaluate SFIX as an investment opportunity.

Stitch Fix (SFIX) is Poised on Operational Excellence & Growth

Stitch Fix's (SFIX) focus on efficiency, client satisfaction and advanced technologies position it for success despite challenges in active client retention.

Yahoo | December 28, 2023

Stitch Fix Announces New Employee Inducement Grants

SAN FRANCISCO, Dec. 15, 2023 (GLOBE NEWSWIRE) -- Stitch Fix, Inc. (NASDAQ:SFIX), the leading online personal styling service, today announced that effective December 15, 2023, the compensation committee of the company’s board of directors granted restricted stock units (RSUs) to two new employees to acquire an aggregate of 283,588 shares of the company’s Class A common stock. One fourth of these restricted stock units will vest on March 13, 2024, and the remainder will vest in 3 equal quarterly

Yahoo | December 15, 2023

Stitch Fix Announces New Employee Inducement Grant

SAN FRANCISCO, Dec. 12, 2023 (GLOBE NEWSWIRE) -- Stitch Fix, Inc. (NASDAQ:SFIX), the leading online personal styling service, today announced that effective December 8, 2023, the compensation committee of the company’s board of directors granted Tony Bacos, Chief Product and Technology Officer, the option to purchase 722,543 shares of the company’s Class A common stock, at a per share exercise price of $3.99, and restricted stock units (RSUs) to acquire 361,272 shares of the company’s Class A co

Yahoo | December 12, 2023

Stitch Fix, Inc. (NASDAQ:SFIX) Q1 2024 Earnings Call Transcript

Stitch Fix, Inc. (NASDAQ:SFIX) Q1 2024 Earnings Call Transcript December 5, 2023 Stitch Fix, Inc. beats earnings expectations. Reported EPS is $-0.22, expectations were $-0.23. Operator: Good afternoon and thank you for standing by. Welcome to the First Quarter of Fiscal Year 2024 Stitch Fix Earnings Call. At this time, all participants will be in […]

Yahoo | December 8, 2023

Stitch Fix Leans Into Private, Fewer Brands to Cut Costs, Improve Margins

Stitch Fix is switching its inventory-offering model toward private brands to reduce its costs and improve its profitability, CEO Matt Baer says on a call with analysts. The styling services company says these brands perform well, and generate higher keep rates among customers, as well as higher margins. Over the past few years, Stitch Fix has increased its private brands from about one-third to nearly 50% of total sales, Baer says.

Yahoo | December 6, 2023

Read More 'SFIX' Stories Here

SFIX Price Returns

1-mo -18.27%
3-mo -26.05%
6-mo -23.48%
1-year -44.89%
3-year -94.53%
5-year -90.65%
YTD -26.05%
2023 14.79%
2022 -83.56%
2021 -67.78%
2020 128.84%
2019 50.15%

Get Free Updates

Join thousands of investors who get the latest news, insights and top rated picks from StockNews.com!