
Superior Group of Companies, Inc. (SGC): Price and Financial Metrics
SGC Price/Volume Stats
| Current price | $20.56 | 52-week high | $21.80 |
| Prev. close | $19.90 | 52-week low | $7.36 |
| Day low | $19.95 | Volume | 81,919 |
| Day high | $20.57 | Avg. volume | 94,624 |
| 50-day MA | $19.75 | Dividend yield | 2.72% |
| 200-day MA | $15.13 | Market Cap | 344.28M |
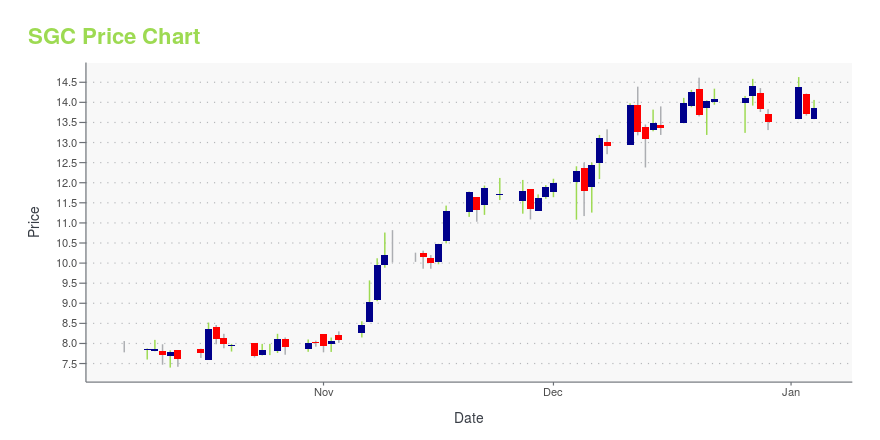
SGC Stock Price Chart Interactive Chart >
Superior Group of Companies, Inc. (SGC) Company Bio
Superior Uniform Group manufactures and sells various apparel and accessories in the United States. The company operates through two segments, Uniforms and Related Products, and Remote Staffing Solutions. The company was founded in 1920 and is based in Seminole, Florida.
Latest SGC News From Around the Web
Below are the latest news stories about SUPERIOR GROUP OF COMPANIES INC that investors may wish to consider to help them evaluate SGC as an investment opportunity.
Returns On Capital At Superior Group of Companies (NASDAQ:SGC) Paint A Concerning PictureIf you're looking at a mature business that's past the growth phase, what are some of the underlying trends that pop... |
Sidoti Events, LLC's Virtual December Small-Cap ConferenceNEW YORK, NY / ACCESSWIRE / December 5, 2023 / Sidoti Events, LLC, an affiliate of Sidoti & Company, LLC, has released the presentation schedule and weblinks for its two-day December Small-Cap Conference taking place Wednesday and Thursday, December ... |
SUPERIOR GROUP OF COMPANIES TO PARTICIPATE IN THE SIDOTI DECEMBER VIRTUAL INVESTOR CONFERENCEST. PETERSBURG, Fla., Nov. 30, 2023 (GLOBE NEWSWIRE) -- Superior Group of Companies, Inc. (NASDAQ: SGC) today announced that Michael Benstock, Chief Executive Officer, and Mike Koempel, Chief Financial Officer, will participate in a fireside chat at the Sidoti December Virtual Investor Conference on Wednesday, December 6, 2023 at 1:45 PM Eastern Time. The live webcast and replay will be available on the Events & Presentations page of the company's Investor Relations website here. Management will |
Investors in Superior Group of Companies (NASDAQ:SGC) have unfortunately lost 43% over the last three yearsIt is doubtless a positive to see that the Superior Group of Companies, Inc. ( NASDAQ:SGC ) share price has gained some... |
Don't Race Out To Buy Superior Group of Companies, Inc. (NASDAQ:SGC) Just Because It's Going Ex-DividendSuperior Group of Companies, Inc. ( NASDAQ:SGC ) is about to trade ex-dividend in the next four days. The ex-dividend... |
SGC Price Returns
| 1-mo | 8.38% |
| 3-mo | 22.73% |
| 6-mo | 49.57% |
| 1-year | 125.44% |
| 3-year | -0.78% |
| 5-year | 39.09% |
| YTD | 54.89% |
| 2023 | 42.28% |
| 2022 | -52.39% |
| 2021 | -3.86% |
| 2020 | 75.53% |
| 2019 | -21.25% |
SGC Dividends
| Ex-Dividend Date | Type | Payout Amount | Change | ||||||
|---|---|---|---|---|---|---|---|---|---|
| Loading, please wait... | |||||||||
Continue Researching SGC
Here are a few links from around the web to help you further your research on Superior Group Of Companies Inc's stock as an investment opportunity:Superior Group Of Companies Inc (SGC) Stock Price | Nasdaq
Superior Group Of Companies Inc (SGC) Stock Quote, History and News - Yahoo Finance
Superior Group Of Companies Inc (SGC) Stock Price and Basic Information | MarketWatch
Loading social stream, please wait...