
The Sage Group plc (SGPYY): Price and Financial Metrics
SGPYY Price/Volume Stats
| Current price | $55.99 | 52-week high | $66.14 |
| Prev. close | $55.25 | 52-week low | $45.71 |
| Day low | $55.34 | Volume | 16,370 |
| Day high | $56.51 | Avg. volume | 33,315 |
| 50-day MA | $54.74 | Dividend yield | 1.09% |
| 200-day MA | $57.27 | Market Cap | 14.04B |
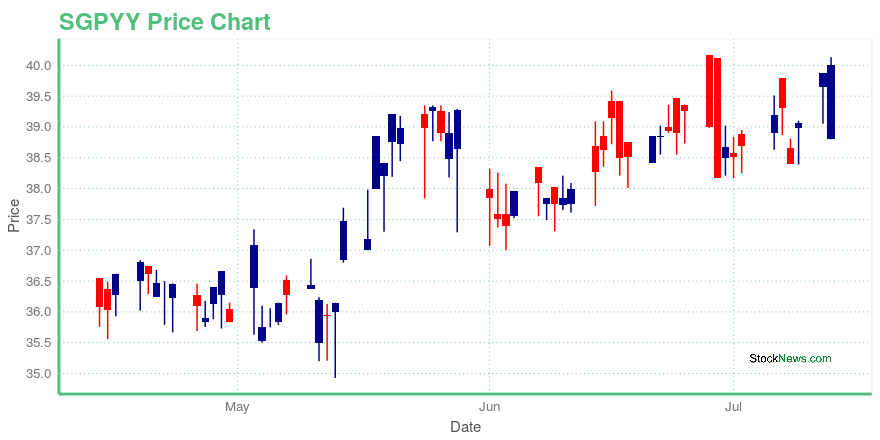
SGPYY Stock Price Chart Interactive Chart >
The Sage Group plc (SGPYY) Company Bio
The Sage Group plc is a software publishing company. The Group develops, publishes, and distributes accounting and payroll software for personal computer systems. Via its subsidiaries, Sage also maintains a registered user database which provides a market for their related products and services, including computer forms, software support contracts, program upgrades, and training.
SGPYY Price Returns
| 1-mo | 1.32% |
| 3-mo | -5.67% |
| 6-mo | -7.42% |
| 1-year | 18.78% |
| 3-year | 47.89% |
| 5-year | 67.95% |
| YTD | -5.16% |
| 2023 | 70.25% |
| 2022 | -23.01% |
| 2021 | 51.08% |
| 2020 | -17.87% |
| 2019 | 33.29% |
SGPYY Dividends
| Ex-Dividend Date | Type | Payout Amount | Change | ||||||
|---|---|---|---|---|---|---|---|---|---|
| Loading, please wait... | |||||||||
Loading social stream, please wait...