
Shoals Technologies Group, Inc. (SHLS): Price and Financial Metrics
SHLS Price/Volume Stats
| Current price | $6.73 | 52-week high | $27.86 |
| Prev. close | $6.74 | 52-week low | $5.69 |
| Day low | $6.63 | Volume | 2,596,600 |
| Day high | $6.94 | Avg. volume | 4,814,915 |
| 50-day MA | $6.81 | Dividend yield | N/A |
| 200-day MA | $11.61 | Market Cap | 1.15B |
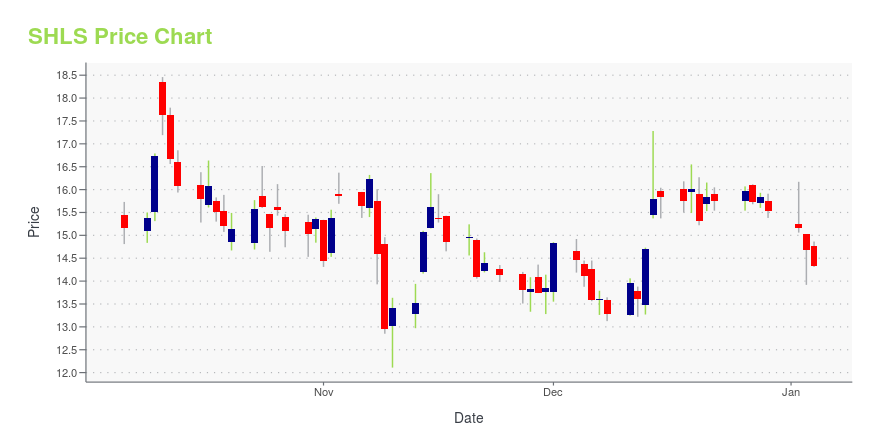
SHLS Stock Price Chart Interactive Chart >
Shoals Technologies Group, Inc. (SHLS) Company Bio
Shoals Technologies Group, Inc. provides electrical balance of system for solar energy projects. The Company offers custom harness solutions, combiner boxes, junction boxes, PV wire, in-line fuses, racking, and string level monitoring solutions. Shoals Technologies Group serves customers worldwide.
Latest SHLS News From Around the Web
Below are the latest news stories about SHOALS TECHNOLOGIES GROUP INC that investors may wish to consider to help them evaluate SHLS as an investment opportunity.
13 Most Promising Tech Stocks According to AnalystsIn this piece, we will take a look at the 13 most promising tech stocks according to analysts. If you want to skip our coverage of the latest developments in the technology industry, then you can skip the introduction and take a look at the 5 Most Promising Tech Stocks According to Analysts. The technology […] |
12 Most Promising Solar Stocks According to AnalystsIn this article, we discuss the 12 most promising solar stocks according to analysts. To skip the detailed overview of the solar industry, go directly to the 5 Most Promising Solar Stocks According to Analysts. Solar energy stocks took a beating in 2023. Global X Solar ETF (RAYS) and Invesco Solar ETF (TAN) are down […] |
12 Most Promising Clean Energy Stocks According to AnalystsIn this piece, we will take a look at the 12 most promising clean energy stocks according to analysts. If you want to skip our analysis of the clean energy industry and the latest news, then take a look at 5 Most Promising Clean Energy Stocks According to Analysts. The clean energy industry made up […] |
Earnings Estimates Rising for Shoals Technologies (SHLS): Will It Gain?Shoals Technologies (SHLS) shares have started gaining and might continue moving higher in the near term, as indicated by solid earnings estimate revisions. |
Does Shoals Technologies (SHLS) Have the Potential to Rally 93.98% as Wall Street Analysts Expect?The average of price targets set by Wall Street analysts indicates a potential upside of 94% in Shoals Technologies (SHLS). While the effectiveness of this highly sought-after metric is questionable, the positive trend in earnings estimate revisions might translate into an upside in the stock. |
SHLS Price Returns
| 1-mo | 3.86% |
| 3-mo | -21.01% |
| 6-mo | -51.44% |
| 1-year | -74.49% |
| 3-year | -76.49% |
| 5-year | N/A |
| YTD | -56.69% |
| 2023 | -37.01% |
| 2022 | 1.52% |
| 2021 | N/A |
| 2020 | N/A |
| 2019 | N/A |
Loading social stream, please wait...