Sunstone Hotel Investors, Inc. Sunstone Hotel Investors, Inc. Common Shares (SHO): Price and Financial Metrics
SHO Price/Volume Stats
Current price | $11.10 | 52-week high | $11.59 |
Prev. close | $11.13 | 52-week low | $8.61 |
Day low | $11.06 | Volume | 956,515 |
Day high | $11.25 | Avg. volume | 1,952,931 |
50-day MA | $10.95 | Dividend yield | 2.21% |
200-day MA | $10.06 | Market Cap | 2.26B |
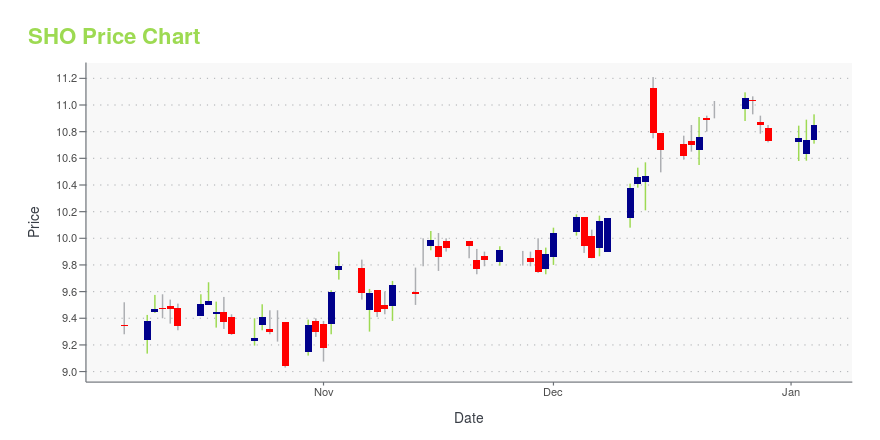
SHO Stock Price Chart Interactive Chart >
SHO POWR Grades
- Value is the dimension where SHO ranks best; there it ranks ahead of 72.4% of US stocks.
- The strongest trend for SHO is in Momentum, which has been heading up over the past 26 weeks.
- SHO ranks lowest in Growth; there it ranks in the 6th percentile.
SHO Stock Summary
- Equity multiplier, or assets relative to shareholders' equity, comes in at 1.48 for SUNSTONE HOTEL INVESTORS INC; that's greater than it is for only 24.35% of US stocks.
- As for revenue growth, note that SHO's revenue has grown 20.15% over the past 12 months; that beats the revenue growth of 76.61% of US companies in our set.
- In terms of volatility of its share price, SHO is more volatile than merely 8.39% of stocks we're observing.
- Stocks with similar financial metrics, market capitalization, and price volatility to SUNSTONE HOTEL INVESTORS INC are WTM, NPO, BH, OGS, and NHC.
- SHO's SEC filings can be seen here. And to visit SUNSTONE HOTEL INVESTORS INC's official web site, go to www.sunstonehotels.com.
SHO Valuation Summary
- In comparison to the median Real Estate stock, SHO's price/sales ratio is 54.17% lower, now standing at 2.2.
- SHO's EV/EBIT ratio has moved down 24.6 over the prior 234 months.
Below are key valuation metrics over time for SHO.
Stock | Date | P/S | P/B | P/E | EV/EBIT |
---|---|---|---|---|---|
SHO | 2023-12-29 | 2.2 | 1.1 | 26.5 | 19.5 |
SHO | 2023-12-28 | 2.2 | 1.1 | 26.8 | 19.7 |
SHO | 2023-12-27 | 2.2 | 1.1 | 27.3 | 19.9 |
SHO | 2023-12-26 | 2.2 | 1.1 | 27.3 | 20.0 |
SHO | 2023-12-22 | 2.2 | 1.1 | 27.1 | 19.8 |
SHO | 2023-12-21 | 2.2 | 1.1 | 26.9 | 19.8 |
SHO Growth Metrics
- The 4 year net cashflow from operations growth rate now stands at -16.2%.
- Its 3 year net income to common stockholders growth rate is now at -63.11%.
- The 2 year price growth rate now stands at 55.8%.
The table below shows SHO's growth in key financial areas (numbers in millions of US dollars).
Date | Revenue | Operating Cash Flow | Net Income to Common Stock |
---|---|---|---|
2022-12-31 | 912.053 | 209.384 | 73.042 |
2022-09-30 | 841.795 | 169.664 | 193.569 |
2022-06-30 | 764.902 | 132.946 | 147.088 |
2022-03-31 | 630.832 | 79.693 | 80.395 |
2021-12-31 | 509.15 | 28.37 | 13.66 |
2021-09-30 | 372.624 | -20.996 | -162.187 |
SHO's Quality Factors
The “Quality” component of the POWR Ratings focuses on 31 different factors of a companies fundamentals and operational strength. Here are some key insights as we drill into the specifics of these quality attributes.- SHO has a Quality Grade of F, ranking ahead of 4.2% of graded US stocks.
- SHO's asset turnover comes in at 0.077 -- ranking 74th of 79 Restaraunts Hotels Motels stocks.
- PK, ARMK, and H are the stocks whose asset turnover ratios are most correlated with SHO.
The table below shows SHO's key quality metrics over time.
Period | Asset Turnover | Gross Margin | ROIC |
---|---|---|---|
2021-06-30 | 0.077 | 0.350 | -0.050 |
2021-03-31 | 0.041 | 0.071 | -0.074 |
2020-12-31 | 0.080 | 0.256 | -0.096 |
2020-09-30 | 0.140 | 0.418 | -0.070 |
2020-06-30 | 0.201 | 0.487 | -0.036 |
2020-03-31 | 0.270 | 0.528 | 0.006 |
SHO Price Target
For more insight on analysts targets of SHO, see our SHO price target page. And for a list of of all stocks sorted by upside potential based on analyst target price, see our Top Price Target page.
Average Price Target | $12.54 | Average Broker Recommendation | 1.96 (Hold) |
Sunstone Hotel Investors, Inc. Sunstone Hotel Investors, Inc. Common Shares (SHO) Company Bio
Sunstone Hotel Investors owns and operates luxury, upper upscale, and upscale full-service hotels in the United States. The company was founded in 1995 and is based in Aliso Viejo, California.
Latest SHO News From Around the Web
Below are the latest news stories about SUNSTONE HOTEL INVESTORS INC that investors may wish to consider to help them evaluate SHO as an investment opportunity.
Sunstone Hotel Investors, Inc. (NYSE:SHO) Q3 2023 Earnings Call TranscriptSunstone Hotel Investors, Inc. (NYSE:SHO) Q3 2023 Earnings Call Transcript November 7, 2023 Sunstone Hotel Investors, Inc. misses on earnings expectations. Reported EPS is $0.06 EPS, expectations were $0.2. Operator: Good morning, ladies and gentlemen, and thank you for standing by. Welcome to the Sunstone Hotel Investors Third Quarter 2023 Earnings Call. At this time, […] |
Sunstone Hotel (SHO) Q3 Earnings: Taking a Look at Key Metrics Versus EstimatesAlthough the revenue and EPS for Sunstone Hotel (SHO) give a sense of how its business performed in the quarter ended September 2023, it might be worth considering how some key metrics compare with Wall Street estimates and the year-ago numbers. |
Sunstone Hotel Investors Inc (SHO) Reports Q3 2023 Earnings: Net Income Drops by 24. ...Despite the challenges posed by the Maui fires, SHO delivers earnings above the high-end of its guidance range |
SUNSTONE HOTEL INVESTORS REPORTS RESULTS FOR THIRD QUARTER 2023Sunstone Hotel Investors, Inc. (the "Company" or "Sunstone") (NYSE: SHO) today announced results for the third quarter ended September 30, 2023. |
SUNSTONE HOTEL INVESTORS ANNOUNCES THE DISPOSITION OF BOSTON PARK PLAZASunstone Hotel Investors, Inc. (the "Company" or "Sunstone") (NYSE: SHO) today announced that it has completed the sale of the 1,060-room Boston Park Plaza (the "Hotel") for a gross sale price of $370 million, or approximately $350,000 per key. The sale price represents a 12.1x multiple on Hotel Adjusted EBITDAre and a 7.1% cap rate on Hotel Net Operating Income for the trailing four quarter period ended June 30, 2023. The Company acquired the Hotel in 2013 and successfully executed a business p |
SHO Price Returns
1-mo | 0.74% |
3-mo | 4.12% |
6-mo | 20.91% |
1-year | 22.97% |
3-year | -6.96% |
5-year | -14.66% |
YTD | 4.12% |
2023 | 14.44% |
2022 | -16.79% |
2021 | 3.53% |
2020 | -18.14% |
2019 | 12.81% |
SHO Dividends
Ex-Dividend Date | Type | Payout Amount | Change | ||||||
---|---|---|---|---|---|---|---|---|---|
Loading, please wait... |
Continue Researching SHO
Want to see what other sources are saying about Sunstone Hotel Investors Inc's financials and stock price? Try the links below:Sunstone Hotel Investors Inc (SHO) Stock Price | Nasdaq
Sunstone Hotel Investors Inc (SHO) Stock Quote, History and News - Yahoo Finance
Sunstone Hotel Investors Inc (SHO) Stock Price and Basic Information | MarketWatch
Loading social stream, please wait...