Steven Madden, Ltd. (SHOO): Price and Financial Metrics
SHOO Price/Volume Stats
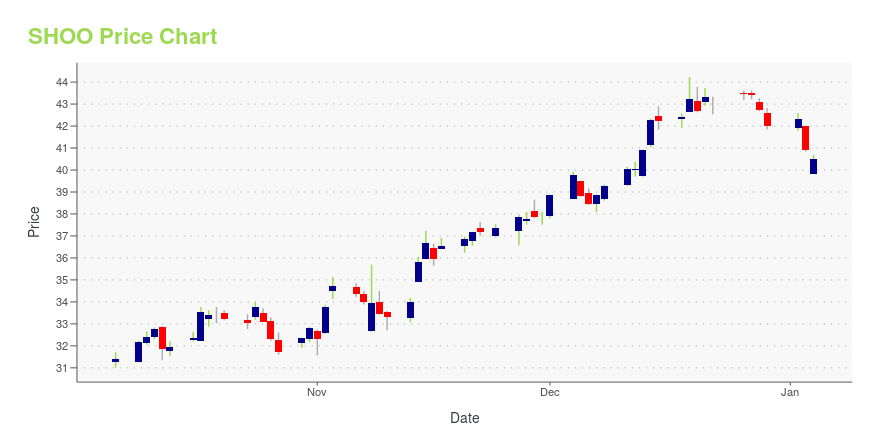
Current price | $31.60 | 52-week high | $40.28 |
Prev. close | $31.00 | 52-week low | $26.36 |
Day low | $30.97 | Volume | 853,900 |
Day high | $31.62 | Avg. volume | 874,658 |
50-day MA | $34.00 | Dividend yield | 2.71% |
200-day MA | $32.60 | Market Cap | 2.40B |
SHOO Stock Price Chart Interactive Chart >
SHOO POWR Grades
- Quality is the dimension where SHOO ranks best; there it ranks ahead of 83.86% of US stocks.
- SHOO's strongest trending metric is Quality; it's been moving up over the last 179 days.
- SHOO's current lowest rank is in the Growth metric (where it is better than 17.92% of US stocks).
SHOO Stock Summary
- SHOO's went public 29.47 years ago, making it older than 79.16% of listed US stocks we're tracking.
- Of note is the ratio of STEVEN MADDEN LTD's sales and general administrative expense to its total operating expenses; 87.44% of US stocks have a lower such ratio.
- STEVEN MADDEN LTD's shareholder yield -- a measure of how much capital is returned to stockholders via dividends and buybacks -- is 9%, greater than the shareholder yield of 80.76% of stocks in our set.
- If you're looking for stocks that are quantitatively similar to STEVEN MADDEN LTD, a group of peers worth examining would be APOG, LRN, CPSH, AVD, and AYI.
- Visit SHOO's SEC page to see the company's official filings. To visit the company's web site, go to www.stevemadden.com.
SHOO Valuation Summary
- SHOO's EV/EBIT ratio is 9.8; this is 29.24% lower than that of the median Consumer Cyclical stock.
- Over the past 243 months, SHOO's price/sales ratio has gone up 0.5.
Below are key valuation metrics over time for SHOO.
Stock | Date | P/S | P/B | P/E | EV/EBIT |
---|---|---|---|---|---|
SHOO | 2023-05-19 | 1.2 | 2.9 | 13.2 | 9.8 |
SHOO | 2023-05-18 | 1.2 | 3.0 | 13.9 | 10.3 |
SHOO | 2023-05-17 | 1.2 | 3.0 | 14.0 | 10.3 |
SHOO | 2023-05-16 | 1.2 | 3.0 | 13.7 | 10.2 |
SHOO | 2023-05-15 | 1.2 | 3.0 | 13.9 | 10.3 |
SHOO | 2023-05-12 | 1.2 | 3.0 | 14.0 | 10.4 |
SHOO Growth Metrics
- The year over year cash and equivalents growth rate now stands at -26.95%.
- Its 3 year cash and equivalents growth rate is now at 6.3%.
- The 4 year price growth rate now stands at 9.08%.

The table below shows SHOO's growth in key financial areas (numbers in millions of US dollars).
Date | Revenue | Operating Cash Flow | Net Income to Common Stock |
---|---|---|---|
2022-09-30 | 2,229.847 | 130.026 | 250.256 |
2022-06-30 | 2,201.946 | 107.826 | 255.602 |
2022-03-31 | 2,064.851 | 134.975 | 243.994 |
2021-12-31 | 1,866.142 | 159.463 | 190.678 |
2021-09-30 | 1,640.628 | 139.783 | 147.283 |
2021-06-30 | 1,458.753 | 78.262 | 73.689 |
SHOO's Quality Factors
The “Quality” component of the POWR Ratings focuses on 31 different factors of a companies fundamentals and operational strength. Here are some key insights as we drill into the specifics of these quality attributes.- SHOO has a Quality Grade of B, ranking ahead of 88.38% of graded US stocks.
- SHOO's asset turnover comes in at 1.373 -- ranking 4th of 32 Apparel stocks.
- COLM, WWW, and RL are the stocks whose asset turnover ratios are most correlated with SHOO.
The table below shows SHOO's key quality metrics over time.
Period | Asset Turnover | Gross Margin | ROIC |
---|---|---|---|
2021-09-30 | 1.373 | 0.405 | 0.360 |
2021-06-30 | 1.273 | 0.401 | 0.181 |
2021-03-31 | 1.060 | 0.391 | 0.043 |
2020-12-31 | 1.063 | 0.387 | -0.059 |
2020-09-30 | 1.101 | 0.391 | -0.055 |
2020-06-30 | 1.185 | 0.386 | 0.072 |
SHOO Price Target
For more insight on analysts targets of SHOO, see our SHOO price target page. And for a list of of all stocks sorted by upside potential based on analyst target price, see our Top Price Target page.
Average Price Target | $48.44 | Average Broker Recommendation | 1.64 (Moderate Buy) |
Steven Madden, Ltd. (SHOO) Company Bio
Steve Madden designs, sources and markets fashion-forward footwear and accessories for women, men and children. The company was founded in 1990 and is based in Long Island City, New York.
Latest SHOO News From Around the Web
Below are the latest news stories about STEVEN MADDEN LTD that investors may wish to consider to help them evaluate SHOO as an investment opportunity.
Steven Madden, Ltd. (SHOO) Q1 2023 Earnings Call TranscriptSteven Madden, Ltd. (SHOO) Q1 2023 Earnings Call May 9, 2023 8:30 AM ET Company Participants Danielle McCoy - Vice President of Corporate Development and Investor Relations Edward Rosenfeld - Chairman and Chief Executive Officer Zine Mazouzi - Chief Financial Officer Conference Call Participants Aubrey Tianello - BNP Paribas Jay Sole - UBS Tom Nikic - Wedbush Securities Laura Champine - Loop Capital Dana Telsey - Telsey Advisory Group Presentation Operator Good morning, everyone, and welcome to the Q1 2023 Steven Madden, Ltd. Earnings Conference Call. All participants will be in a listen-only mode. [Operator Instructions]. After... |
Steven Madden (NASDAQ:SHOO) Is Paying Out A Dividend Of $0.21Steven Madden, Ltd. ( NASDAQ:SHOO ) has announced that it will pay a dividend of $0.21 per share on the 23rd of June... |
Steven Madden (SHOO) Q1 Earnings Miss, Revenues Down Y/YSteven Madden's (SHOO) first-quarter 2023 results reflect the impacts of a challenging operating backdrop. On a positive note, sales beat the Zacks Consensus Estimate. |
Steven Madden (SHOO) Misses Q1 Earnings EstimatesSteven Madden (SHOO) delivered earnings and revenue surprises of -3.85% and 2.64%, respectively, for the quarter ended March 2023. Do the numbers hold clues to what lies ahead for the stock? |
Steve Madden Announces First Quarter 2023 ResultsIncreases Share Repurchase AuthorizationLONG ISLAND CITY, N.Y., May 09, 2023 (GLOBE NEWSWIRE) -- Steven Madden, Ltd. (Nasdaq: SHOO), a leading designer and marketer of fashion-forward footwear, accessories and apparel for women, men and children, today announced financial results for the first quarter ended March 31, 2023. Amounts referred to as “Adjusted” are non-GAAP measures that exclude the items defined as “Non-GAAP Adjustments” in the “Non-GAAP Reconciliation” section. First Quarter 2023 R |
SHOO Price Returns
1-mo | -7.82% |
3-mo | -12.36% |
6-mo | -8.73% |
1-year | -12.85% |
3-year | 40.49% |
5-year | -3.52% |
YTD | -0.54% |
2022 | -29.52% |
2021 | 33.46% |
2020 | -17.43% |
2019 | 44.42% |
2018 | -1.31% |
SHOO Dividends
Ex-Dividend Date | Type | Payout Amount | Change | ||||||
---|---|---|---|---|---|---|---|---|---|
Loading, please wait... |
Continue Researching SHOO
Want to do more research on Steven Madden Ltd's stock and its price? Try the links below:Steven Madden Ltd (SHOO) Stock Price | Nasdaq
Steven Madden Ltd (SHOO) Stock Quote, History and News - Yahoo Finance
Steven Madden Ltd (SHOO) Stock Price and Basic Information | MarketWatch
Loading social stream, please wait...