The Shyft Group Inc (SHYF): Price and Financial Metrics
SHYF Price/Volume Stats
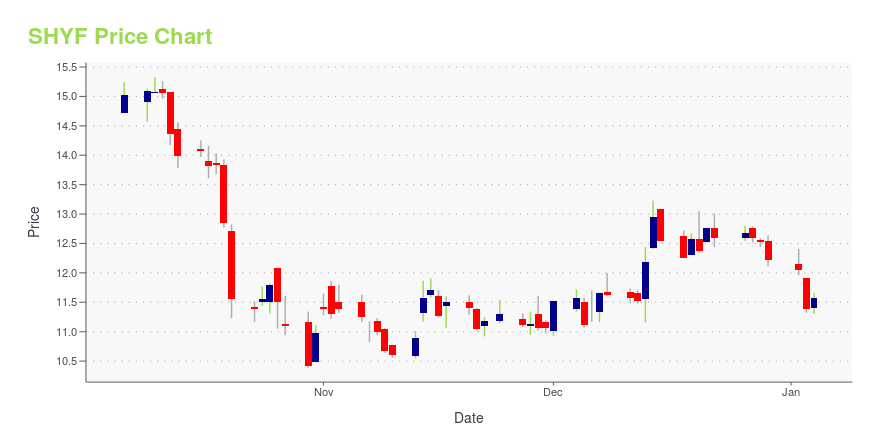
Current price | $12.42 | 52-week high | $27.36 |
Prev. close | $12.17 | 52-week low | $9.81 |
Day low | $12.13 | Volume | 117,700 |
Day high | $12.47 | Avg. volume | 270,628 |
50-day MA | $11.08 | Dividend yield | 1.68% |
200-day MA | $14.03 | Market Cap | 426.18M |
SHYF Stock Price Chart Interactive Chart >
SHYF POWR Grades
- Value is the dimension where SHYF ranks best; there it ranks ahead of 94.66% of US stocks.
- SHYF's strongest trending metric is Growth; it's been moving down over the last 26 weeks.
- SHYF's current lowest rank is in the Growth metric (where it is better than 2.97% of US stocks).
SHYF Stock Summary
- SHYFT GROUP INC's capital turnover -- a measure of revenue relative to shareholder's equity -- is better than 86.32% of US listed stocks.
- SHYFT GROUP INC's stock had its IPO on March 26, 1990, making it an older stock than 84.83% of US equities in our set.
- With a price/sales ratio of 0.4, SHYFT GROUP INC has a higher such ratio than merely 13.03% of stocks in our set.
- If you're looking for stocks that are quantitatively similar to SHYFT GROUP INC, a group of peers worth examining would be LNN, INTT, LIQT, PLPC, and ECOR.
- SHYF's SEC filings can be seen here. And to visit SHYFT GROUP INC's official web site, go to www.theshyftgroup.com.
SHYF Valuation Summary
- In comparison to the median Industrials stock, SHYF's price/sales ratio is 66.67% lower, now standing at 0.4.
- SHYF's price/sales ratio has moved down 0.1 over the prior 243 months.
Below are key valuation metrics over time for SHYF.
Stock | Date | P/S | P/B | P/E | EV/EBIT |
---|---|---|---|---|---|
SHYF | 2023-12-29 | 0.4 | 1.6 | 14.6 | 14.5 |
SHYF | 2023-12-28 | 0.4 | 1.7 | 14.9 | 14.7 |
SHYF | 2023-12-27 | 0.4 | 1.7 | 15.0 | 14.8 |
SHYF | 2023-12-26 | 0.4 | 1.7 | 15.1 | 14.9 |
SHYF | 2023-12-22 | 0.4 | 1.7 | 15.0 | 14.8 |
SHYF | 2023-12-21 | 0.5 | 1.7 | 15.2 | 14.9 |
SHYF Growth Metrics
- Its 2 year cash and equivalents growth rate is now at -90.98%.
- Its year over year net income to common stockholders growth rate is now at 46.23%.
- Its 5 year revenue growth rate is now at 12.08%.
The table below shows SHYF's growth in key financial areas (numbers in millions of US dollars).
Date | Revenue | Operating Cash Flow | Net Income to Common Stock |
---|---|---|---|
2022-12-31 | 1,027.164 | -18.843 | 36.558 |
2022-09-30 | 1,002.453 | -12.807 | 39.181 |
2022-06-30 | 989 | 34.112 | 42.817 |
2022-03-31 | 1,000.787 | 47.528 | 53.497 |
2021-12-31 | 991.792 | 74.009 | 68.925 |
2021-09-30 | 886.074 | 86.008 | 56.094 |
SHYF's Quality Factors
The “Quality” component of the POWR Ratings focuses on 31 different factors of a companies fundamentals and operational strength. Here are some key insights as we drill into the specifics of these quality attributes.- SHYF has a Quality Grade of B, ranking ahead of 78.93% of graded US stocks.
- SHYF's asset turnover comes in at 2.188 -- ranking 2nd of 68 Automobiles and Trucks stocks.
- CVGI, WGO, and VC are the stocks whose asset turnover ratios are most correlated with SHYF.
The table below shows SHYF's key quality metrics over time.
Period | Asset Turnover | Gross Margin | ROIC |
---|---|---|---|
2021-09-30 | 2.188 | 0.207 | 0.318 |
2021-06-30 | 2.062 | 0.218 | 0.303 |
2021-03-31 | 1.837 | 0.215 | 0.212 |
2020-12-31 | 1.809 | 0.216 | 0.184 |
2020-09-30 | 1.236 | 0.274 | 0.050 |
2020-06-30 | 1.351 | 0.219 | 0.003 |
SHYF Price Target
For more insight on analysts targets of SHYF, see our SHYF price target page. And for a list of of all stocks sorted by upside potential based on analyst target price, see our Top Price Target page.
Average Price Target | $49.50 | Average Broker Recommendation | 1.33 (Strong Buy) |
The Shyft Group Inc (SHYF) Company Bio
The Shyft Group Inc offers commercial vehicles. The Company distributes and manufactures trucks, trailers, tempo, and other related products. Shyft Group serves customers worldwide.
Latest SHYF News From Around the Web
Below are the latest news stories about SHYFT GROUP INC that investors may wish to consider to help them evaluate SHYF as an investment opportunity.
Should You Investigate The Shyft Group, Inc. (NASDAQ:SHYF) At US$12.76?The Shyft Group, Inc. ( NASDAQ:SHYF ), is not the largest company out there, but it received a lot of attention from a... |
Pleasing Signs As A Number Of Insiders Buy Shyft Group StockWhen a single insider purchases stock, it is typically not a major deal. However, when multiple insiders purchase... |
11 Stocks Under $25 To Buy NowIn this piece, we will take a look at the 11 stocks under $25 to buy now. If you want to skip our overview of the stock market, some recent news, and the broader investment climate, then take a look at 5 Stocks Under $25 To Buy Now. With 2024 coming to a close, the […] |
The Shyft Group, Inc.'s (NASDAQ:SHYF) Intrinsic Value Is Potentially 44% Above Its Share PriceKey Insights Using the 2 Stage Free Cash Flow to Equity, Shyft Group fair value estimate is US$16.06 Shyft Group's... |
Is It Smart To Buy The Shyft Group, Inc. (NASDAQ:SHYF) Before It Goes Ex-Dividend?Regular readers will know that we love our dividends at Simply Wall St, which is why it's exciting to see The Shyft... |
SHYF Price Returns
1-mo | 21.76% |
3-mo | 2.10% |
6-mo | -16.30% |
1-year | -43.45% |
3-year | -65.33% |
5-year | 46.29% |
YTD | 2.10% |
2023 | -50.28% |
2022 | -49.04% |
2021 | 73.54% |
2020 | 57.85% |
2019 | 152.15% |
SHYF Dividends
Ex-Dividend Date | Type | Payout Amount | Change | ||||||
---|---|---|---|---|---|---|---|---|---|
Loading, please wait... |
Loading social stream, please wait...