Siebert Financial Corp. (SIEB): Price and Financial Metrics
SIEB Price/Volume Stats
Current price | $1.95 | 52-week high | $3.05 |
Prev. close | $2.03 | 52-week low | $1.20 |
Day low | $1.95 | Volume | 8,000 |
Day high | $2.01 | Avg. volume | 99,220 |
50-day MA | $2.17 | Dividend yield | N/A |
200-day MA | $2.03 | Market Cap | 77.18M |
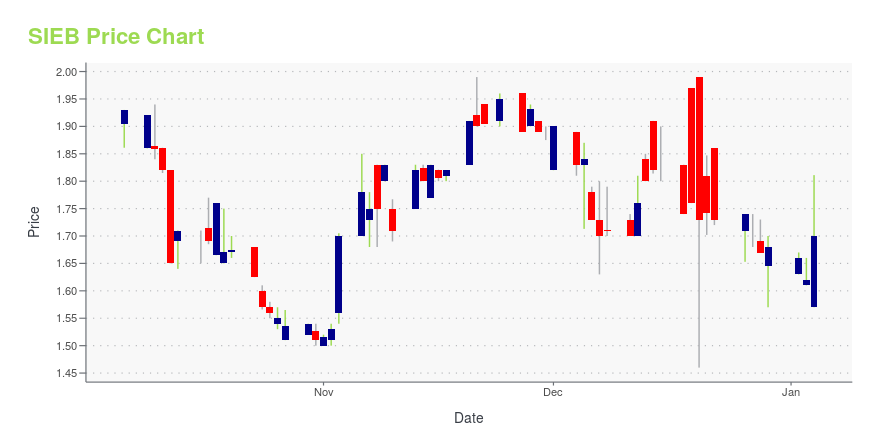
SIEB Stock Price Chart Interactive Chart >
SIEB Stock Summary
- Equity multiplier, or assets relative to shareholders' equity, comes in at 16.11 for SIEBERT FINANCIAL CORP; that's greater than it is for 96.48% of US stocks.
- With a year-over-year growth in debt of -54.67%, SIEBERT FINANCIAL CORP's debt growth rate surpasses just 4.95% of about US stocks.
- Over the past twelve months, SIEB has reported earnings growth of 873.76%, putting it ahead of 98.13% of US stocks in our set.
- If you're looking for stocks that are quantitatively similar to SIEBERT FINANCIAL CORP, a group of peers worth examining would be RES, ANTE, IONM, EFSC, and GFAI.
- Visit SIEB's SEC page to see the company's official filings. To visit the company's web site, go to www.siebertnet.com.
SIEB Valuation Summary
- In comparison to the median Financial Services stock, SIEB's EV/EBIT ratio is 321.24% lower, now standing at -25.
- Over the past 243 months, SIEB's price/sales ratio has gone down 2.7.
Below are key valuation metrics over time for SIEB.
Stock | Date | P/S | P/B | P/E | EV/EBIT |
---|---|---|---|---|---|
SIEB | 2023-09-15 | 1.4 | 1.3 | 21.4 | -25.0 |
SIEB | 2023-09-14 | 1.4 | 1.2 | 20.8 | -25.3 |
SIEB | 2023-09-13 | 1.4 | 1.2 | 20.6 | -25.5 |
SIEB | 2023-09-12 | 1.3 | 1.1 | 19.3 | -26.2 |
SIEB | 2023-09-11 | 1.3 | 1.1 | 19.3 | -26.3 |
SIEB | 2023-09-08 | 1.3 | 1.2 | 19.6 | -26.1 |
SIEB Growth Metrics
- The 3 year price growth rate now stands at -81.88%.
- Its 5 year net income to common stockholders growth rate is now at 171.27%.
- The 4 year net cashflow from operations growth rate now stands at 409.5%.

The table below shows SIEB's growth in key financial areas (numbers in millions of US dollars).
Date | Revenue | Operating Cash Flow | Net Income to Common Stock |
---|---|---|---|
2022-09-30 | 51.142 | -28.466 | 1.279 |
2022-06-30 | 53.857 | -21.946 | 1.097 |
2022-03-31 | 58.927 | -48.332 | 1.815 |
2021-12-31 | 67.507 | 5.543 | 5.063 |
2021-09-30 | 67.645 | 65.717 | 5.493 |
2021-06-30 | 63.169 | 90.34 | 5.204 |
SIEB's Quality Factors
The “Quality” component of the POWR Ratings focuses on 31 different factors of a companies fundamentals and operational strength. Here are some key insights as we drill into the specifics of these quality attributes.- SIEB has a Quality Grade of C, ranking ahead of 70.31% of graded US stocks.
- SIEB's asset turnover comes in at 0.057 -- ranking 296th of 454 Trading stocks.
- EQC, MAA, and HNNA are the stocks whose asset turnover ratios are most correlated with SIEB.
The table below shows SIEB's key quality metrics over time.
Period | Asset Turnover | Gross Margin | ROIC |
---|---|---|---|
2021-06-30 | 0.057 | 0.397 | -0.024 |
2021-03-31 | 0.062 | 0.389 | -0.021 |
2020-12-31 | 0.074 | 0.388 | -0.016 |
2020-09-30 | 0.118 | 0.387 | -0.019 |
2020-06-30 | 0.173 | 0.404 | -0.046 |
2020-03-31 | 0.315 | 0.436 | -0.161 |
Siebert Financial Corp. (SIEB) Company Bio
Siebert Financial Corp. The company was founded in 1886 and is based in New York City, New York. As of December 16, 2016, Siebert Financial Corp. operates as a subsidiary of Kennedy Cabot Acquisition, LLC.engages in the retail discount brokerage and investment advisory businesses.
Latest SIEB News From Around the Web
Below are the latest news stories about SIEBERT FINANCIAL CORP that investors may wish to consider to help them evaluate SIEB as an investment opportunity.
Siebert Reports Second Quarter 2023 Financial ResultsNEW YORK, August 07, 2023--Siebert Financial Corp. (NASDAQ: SIEB) ("Siebert"), a diversified provider of financial services, today reported financial results for the second quarter ended June 30, 2023. |
Siebert Financial (NASDAQ:SIEB) shareholders have endured a 81% loss from investing in the stock five years agoWe're definitely into long term investing, but some companies are simply bad investments over any time frame. We really... |
Siebert Announces Chairman and CEO Appointment, New Board Member, and Close of Kakao Pay’s $17.4 Million Investment in SiebertNEW YORK, May 30, 2023--Siebert Financial Corp. (NASDAQ: SIEB) ("Siebert"), a diversified provider of financial services, today announced that John J. Gebbia has been appointed as Chairman of the Board and Chief Executive Officer of Siebert, effective 5/24/23, the appointment of Simon Shin to Siebert’s Board of Directors, and the close of Kakao Pay’s $17.4 million investment in Siebert. |
Siebert Achieves Strong 2023 Q1 ResultsNEW YORK, May 15, 2023--Siebert Financial Corp. (NASDAQ: SIEB) ("Siebert"), a diversified provider of financial services, today reported financial results for the first quarter ended March 31, 2023. |
Today’s Biggest Pre-Market Stock Movers: 10 Top Gainers and Losers on FridayThe biggest pre-market stock movers are a hot topic traders are going to want to know about with all the latest news on Friday! |
SIEB Price Returns
1-mo | -8.45% |
3-mo | N/A |
6-mo | 12.07% |
1-year | 31.76% |
3-year | -42.14% |
5-year | -85.84% |
YTD | 43.38% |
2022 | -41.38% |
2021 | -44.76% |
2020 | -51.45% |
2019 | -40.18% |
2018 | 7.11% |
Continue Researching SIEB
Want to do more research on Siebert Financial Corp's stock and its price? Try the links below:Siebert Financial Corp (SIEB) Stock Price | Nasdaq
Siebert Financial Corp (SIEB) Stock Quote, History and News - Yahoo Finance
Siebert Financial Corp (SIEB) Stock Price and Basic Information | MarketWatch
Loading social stream, please wait...