
SilverCrest Metals Inc. (SILV): Price and Financial Metrics
SILV Price/Volume Stats
| Current price | $9.14 | 52-week high | $10.27 |
| Prev. close | $9.06 | 52-week low | $4.16 |
| Day low | $9.10 | Volume | 827,779 |
| Day high | $9.27 | Avg. volume | 1,497,071 |
| 50-day MA | $8.80 | Dividend yield | N/A |
| 200-day MA | $6.85 | Market Cap | 1.36B |
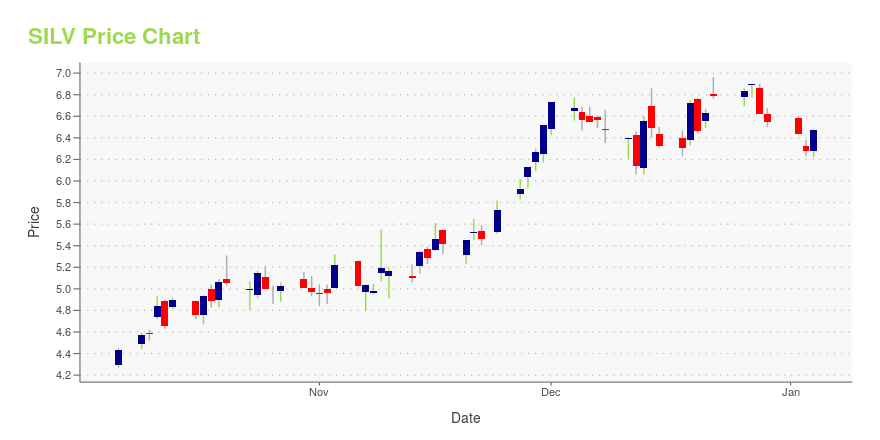
SILV Stock Price Chart Interactive Chart >
SilverCrest Metals Inc. (SILV) Company Bio
SilverCrest Metals, Inc. engages in the exploration, acquisition, and development of mineral properties and precious metals. It focuses on new discoveries, value-added acquisitions, and targeting production in Mexico's historic precious metal districts. Its portfolio includes Las Chispas, Cruz de Mayo, Angel de Plata, and Estacion Llano. The company was founded on June 23, 2015 and is headquartered in Vancouver, Canada.
Latest SILV News From Around the Web
Below are the latest news stories about SILVERCREST METALS INC that investors may wish to consider to help them evaluate SILV as an investment opportunity.
SilverCrest Reports Third Quarter 2023 ResultsSilverCrest Metals Inc. ("SilverCrest" or the "Company") is pleased to announce its financial results for the third quarter of 2023 ("Q3, 2023"). This release also provides additional operational results, expanding on the October 10, 2023 release of Q3, 2023 operational results from the Company's Las Chispas operation ("Las Chispas" or the "Operation") located in Sonora, Mexico. All amounts herein are presented in United States Dollars ("US$"), unless otherwise stated. Certain amounts shown in t |
SilverCrest Provides Third Quarter 2023 Operational ResultsSilverCrest Metals Inc. ("SilverCrest" or the "Company") is pleased to provide operational results for the third quarter of 2023 ("Q3, 2023") from the Company's Las Chispas Operation ("Las Chispas" or the "Operation") located in Sonora, Mexico. Full disclosure of the Company's Q3, 2023 financial results will be included in the Company's consolidated interim financial statements for the period ended September 30, 2023 which will be released on November 8th, 2023. All amounts herein are presented |
SilverCrest Metals becoming a low-cost silver production powerhouse with Las Chispas projectSilverCrest Metals President Chris Ritchie joined Steve Darling from Proactive to share news the company has announced its guidance for the Las Chispas Operation in Mexico, increasing its expected ... |
SilverCrest Announces Filing of NI 43-101 Technical Report on Las ChispasSilverCrest Metals Inc. ("SilverCrest" or the "Company") is pleased to announce it has filed on SEDAR+ the Updated Independent Technical Report for the 100% owned Las Chispas Operation (the "Updated Technical Report" or the "Report") located in the State of Sonora, Mexico. The Report was prepared in accordance with National Instrument 43-101. |
SilverCrest Announces Normal Course Issuer BidSilverCrest Metals Inc. ("SilverCrest" or the "Company") is pleased to announce that it has filed with and received acceptance from the Toronto Stock Exchange (the "TSX") for a Notice of Intention to make a Normal Course Issuer Bid ("NCIB") pursuant to TSX requirements permitting the Company to purchase up to 7,361,563 common shares of the Company ("Common Shares"), representing approximately 5% of SilverCrest's total issued and outstanding Common Shares. As of August 9, 2023 SilverCrest had 147 |
SILV Price Returns
| 1-mo | 9.99% |
| 3-mo | 7.15% |
| 6-mo | 62.63% |
| 1-year | 73.43% |
| 3-year | 12.84% |
| 5-year | 79.22% |
| YTD | 39.54% |
| 2023 | 9.17% |
| 2022 | -24.15% |
| 2021 | -29.25% |
| 2020 | 65.88% |
| 2019 | 130.03% |
Loading social stream, please wait...