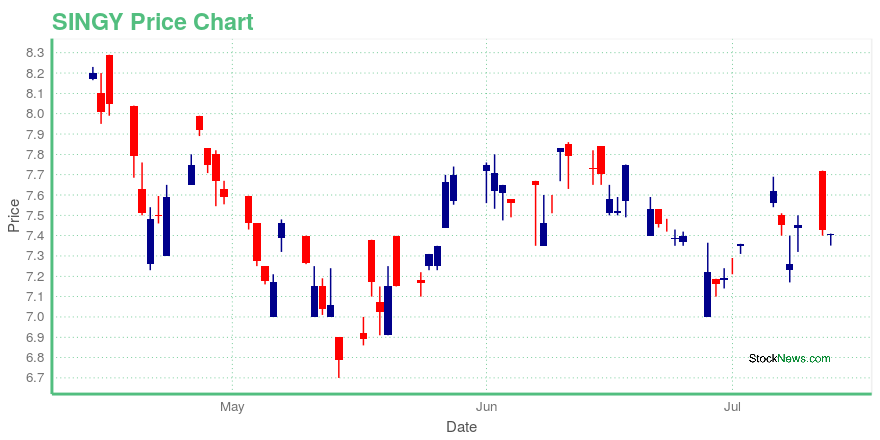
Singapore Airlines Limited (SINGY): Price and Financial Metrics
SINGY Price/Volume Stats
| Current price | $10.12 | 52-week high | $10.75 |
| Prev. close | $10.16 | 52-week low | $8.63 |
| Day low | $10.11 | Volume | 2,846 |
| Day high | $10.14 | Avg. volume | 32,692 |
| 50-day MA | $9.86 | Dividend yield | 1.31% |
| 200-day MA | $9.67 | Market Cap | N/A |
SINGY Stock Price Chart Interactive Chart >
Singapore Airlines Limited (SINGY) Company Bio
Singapore Airlines Limited provides air transportation, engineering, pilot training, air charter, and tour wholesaling services. The Company's airline operation covers Asia, Europe, the Americas, South West Pacific, and Africa.
SINGY Price Returns
| 1-mo | 0.10% |
| 3-mo | 8.41% |
| 6-mo | 3.90% |
| 1-year | 5.53% |
| 3-year | 27.94% |
| 5-year | 18.85% |
| YTD | 7.95% |
| 2024 | -4.92% |
| 2023 | 20.24% |
| 2022 | 11.04% |
| 2021 | 13.79% |
| 2020 | -50.76% |
SINGY Dividends
| Ex-Dividend Date | Type | Payout Amount | Change | ||||||
|---|---|---|---|---|---|---|---|---|---|
| Loading, please wait... | |||||||||


Loading social stream, please wait...