
Six Flags Entertainment Corporation New (SIX): Price and Financial Metrics
SIX Price/Volume Stats
| Current price | $32.00 | 52-week high | $34.06 |
| Prev. close | $33.14 | 52-week low | $18.29 |
| Day low | $31.92 | Volume | 16,922,500 |
| Day high | $33.58 | Avg. volume | 1,235,753 |
| 50-day MA | $26.88 | Dividend yield | N/A |
| 200-day MA | $24.80 | Market Cap | 2.70B |
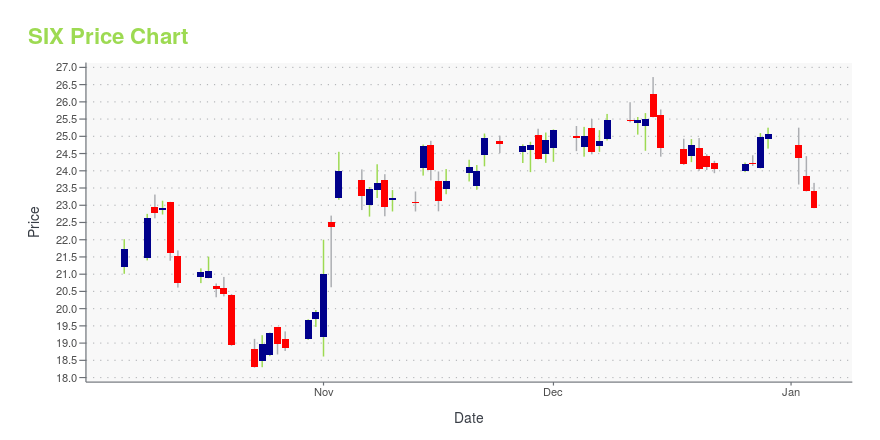
SIX Stock Price Chart Interactive Chart >
Six Flags Entertainment Corporation New (SIX) Company Bio
Six Flags Entertainment owns and operates regional theme and water parks. The company was founded in 1971 and is based in Grand Prairie, Texas.
Latest SIX News From Around the Web
Below are the latest news stories about SIX FLAGS ENTERTAINMENT CORP that investors may wish to consider to help them evaluate SIX as an investment opportunity.
Disney (DIS) Unveils Zootopia-Inspired Theme Park in ChinaDisney (DIS) launches Zootopia, the much-anticipated new land based on the Academy Award-winning Walt Disney Animation Studios film. |
Upstart, Affirm, Six Flags, Delta, United: Trending tickersUS stocks (^GSPC) added to the previous session's rally Thursday after the Federal Reserve's 'dot plot' implied three rate cuts in 2024. Lending platforms Upstart (UPST) and Affirm (AFRM) are among Thursday's market winners as shares jumped amid optimism for lower borrowing costs next year. Morgan Stanley upgraded amusement park operator Six Flags (SIX) to "Overweight" from "Equal Weight" and raised its price target to $32 on expectations for accelerating revenue growth in 2024. Goldman Sachs named Delta (DAL) and United (UAL) its top airline stock picks for 2024. Analyst Catherine O’Brien sees an acceleration in Delta's high-margin segments and United's premium travel exposures as catalysts for the stocks next year. Yahoo Finance's Seana Smith and Brad Smith break down all the details... |
Cedar Fair investor cries foul over $8 billion Six Flags mergerOne of Cedar Fair's largest investors has sent a letter to the U.S. amusement park operator to complain that the company is stripping shareholders from a say on its planned $8 billion merger with Six Flags Entertainment Corp. Neuberger Berman, which owns about 3% of Cedar Fair, told Reuters it wrote to the company on Dec. 4 to complain that it structured the deal so that shareholders will not get to vote on it as Six Flags shareholders will. This was achieved, according to Neuberger, by having Six Flags pay out a $85 million special dividend that shrunk its size and allowed Cedar Fair to be deemed the acquirer in the transaction. |
An Intrinsic Calculation For Six Flags Entertainment Corporation (NYSE:SIX) Suggests It's 34% UndervaluedKey Insights The projected fair value for Six Flags Entertainment is US$38.41 based on 2 Stage Free Cash Flow to Equity... |
7 Top-Rated Growth Stocks That Analysts Are Loving NowAs the market rally continues to build steam, you may be looking for top-rated growth stocks now. |
SIX Price Returns
| 1-mo | 2.76% |
| 3-mo | 34.85% |
| 6-mo | 29.82% |
| 1-year | 36.75% |
| 3-year | -23.92% |
| 5-year | -35.88% |
| YTD | 27.59% |
| 2023 | 7.87% |
| 2022 | -45.40% |
| 2021 | 24.87% |
| 2020 | -23.65% |
| 2019 | -13.74% |
Continue Researching SIX
Want to do more research on Six Flags Entertainment Corp's stock and its price? Try the links below:Six Flags Entertainment Corp (SIX) Stock Price | Nasdaq
Six Flags Entertainment Corp (SIX) Stock Quote, History and News - Yahoo Finance
Six Flags Entertainment Corp (SIX) Stock Price and Basic Information | MarketWatch
Loading social stream, please wait...