
Scienjoy Holding Corporation (SJ): Price and Financial Metrics
SJ Price/Volume Stats
| Current price | $0.95 | 52-week high | $4.77 |
| Prev. close | $0.94 | 52-week low | $0.66 |
| Day low | $0.85 | Volume | 55,483 |
| Day high | $1.00 | Avg. volume | 137,033 |
| 50-day MA | $0.99 | Dividend yield | N/A |
| 200-day MA | $1.72 | Market Cap | 36.59M |
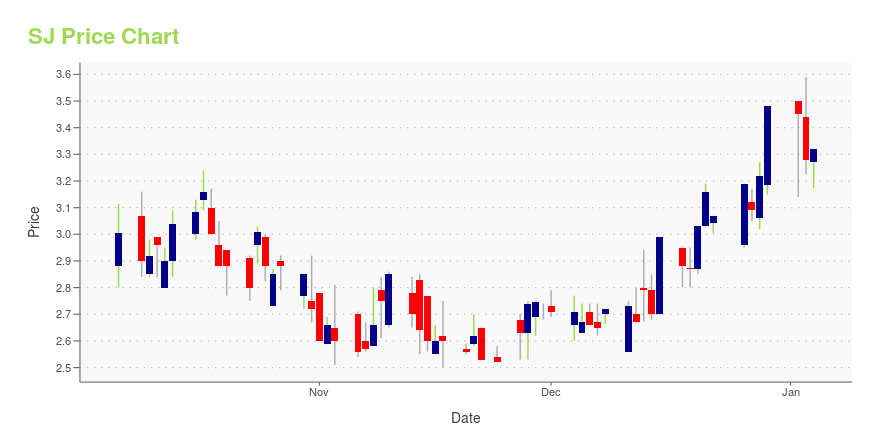
SJ Stock Price Chart Interactive Chart >
Scienjoy Holding Corporation (SJ) Company Bio
Sixiang Wuxian (Beijing) Technology Co., Ltd. is based in Beijing, China. Scienjoy Holding Corporation operates as a subsidiary of Scienjoy International Limited.
Latest SJ News From Around the Web
Below are the latest news stories about SCIENJOY HOLDING CORP that investors may wish to consider to help them evaluate SJ as an investment opportunity.
Scienjoy Holding Corporation (NASDAQ:SJ) insiders have significant skin in the game with 40% ownershipKey Insights Significant insider control over Scienjoy Holding implies vested interests in company growth 59% of the... |
SJ Stock Earnings: Scienjoy Holding Reported Results for Q3 2023Scienjoy Holding just reported results for the third quarter of 2023. |
Scienjoy Holding Corporation Reports Nine months ended September 30, 2023 Unaudited Financial ResultsScienjoy Holding Corporation ("Scienjoy", the "Company", or "we") (NASDAQ: SJ), an interactive entertainment leader in the Chinese market, today announced its unaudited financial results for the nine months ended September 30, 2023. |
Is There Now An Opportunity In Scienjoy Holding Corporation (NASDAQ:SJ)?Scienjoy Holding Corporation ( NASDAQ:SJ ), might not be a large cap stock, but it received a lot of attention from a... |
Scienjoy to Participate and Present at the LD Micro Main Event XVI on October 3-5, 2023Scienjoy Holding Corporation (NASDAQ: SJ) ("Scienjoy" or the "Company"), a leading provider of live streaming and entertainment platforms in the Chinese market, today announced that the Company's key executives will participate and present in both group presentation and private one-on-one meetings with analysts and investors at the LD Micro Main Event XVI being held from October 3-5, 2023 at the Luxe Sunset Boulevard Hotel in Los Angeles, California. |
SJ Price Returns
| 1-mo | 3.50% |
| 3-mo | 20.88% |
| 6-mo | -69.45% |
| 1-year | -69.75% |
| 3-year | -82.18% |
| 5-year | -90.56% |
| YTD | -72.70% |
| 2023 | 76.65% |
| 2022 | -65.32% |
| 2021 | -34.41% |
| 2020 | -14.59% |
| 2019 | N/A |
Loading social stream, please wait...